Performance Measurement: A Guide for Ecommerce Growth
You're probably looking at three different dashboards right now.
Shopify says orders are up. Google Analytics shows a traffic spike. Your helpdesk says ticket volume is getting worse. Finance is asking why margins feel tighter even though top-line sales look healthy. Nobody is exactly wrong, but nobody has the full picture either.
That's the point where most ecommerce teams mistake reporting for performance measurement. Reporting tells you what happened. Performance measurement tells you what to do next. In practice, that difference decides whether you keep funding channels and workflows that look good on paper but create support cost, fulfillment friction, and customer dissatisfaction after checkout.
I've seen this most often in post-purchase operations. Teams obsess over conversion rate, average order value, and campaign returns, then treat the period after payment as a service problem instead of a growth and efficiency problem. The result is predictable. Support gets overloaded, customers hit avoidable friction, and leadership still can't prove which operational changes improved profitability.
The fix isn't another dashboard. It's a system. If you need help stitching together repetitive reporting, workflow handoffs, or operational alerts, working with an AI automation agency can help reduce manual effort around the measurement process itself. But the bigger shift is deciding what deserves measurement in the first place.
From Data Overload to Actionable Insight
A lot of ecommerce teams have data. What they lack is a decision model.
One store tracks ad performance by channel, another tracks merchandising by collection, support tracks first reply time, and operations watches fulfillment exceptions. Every team can show metrics. Very few can explain how those metrics connect to profit, customer satisfaction, and workload. That's why meetings drift into opinion. One team argues for more acquisition spend, another argues for more support headcount, and neither side can show the downstream effect with confidence.
What the overload actually looks like
The pattern is familiar:
- Marketing owns traffic and conversion data but often stops at the order confirmation page.
- Support owns ticket trends but may not classify issues in a way operations can act on.
- Operations owns shipping, edits, and exceptions but often reports in spreadsheets outside the main business dashboard.
- Leadership sees revenue first because revenue is easy to summarize, even when the underlying system is straining.
That's how stores end up chasing vanity metrics. A campaign can look successful while creating a flood of order-change requests. A merchandising test can raise order volume while increasing error risk. A customer experience initiative can reduce friction, but if nobody measures the operational impact, it gets treated like a “nice to have” instead of a cost control lever.
The best ecommerce measurement systems don't ask, “What can we track?” They ask, “What decision will this number improve?”
What actionable insight looks like
Actionable insight has three traits.
First, it connects a metric to an owner. If nobody is responsible for explaining movement, the number is decoration.
Second, it connects a metric to a business lever. If ticket volume rises, can the team change policy, workflow, tooling, or self-service options to affect it?
Third, it connects front-end growth with back-end consequences. That's where ecommerce operators separate noise from signal. A number matters when it helps you improve margin, reduce rework, protect customer satisfaction, or increase the value of an order without creating support drag.
What Is Performance Measurement Really
Performance measurement is the operating system behind good decisions. It isn't a stack of charts. It's the method a business uses to understand whether strategy is producing the right outcomes and whether the business is healthy enough to sustain growth.
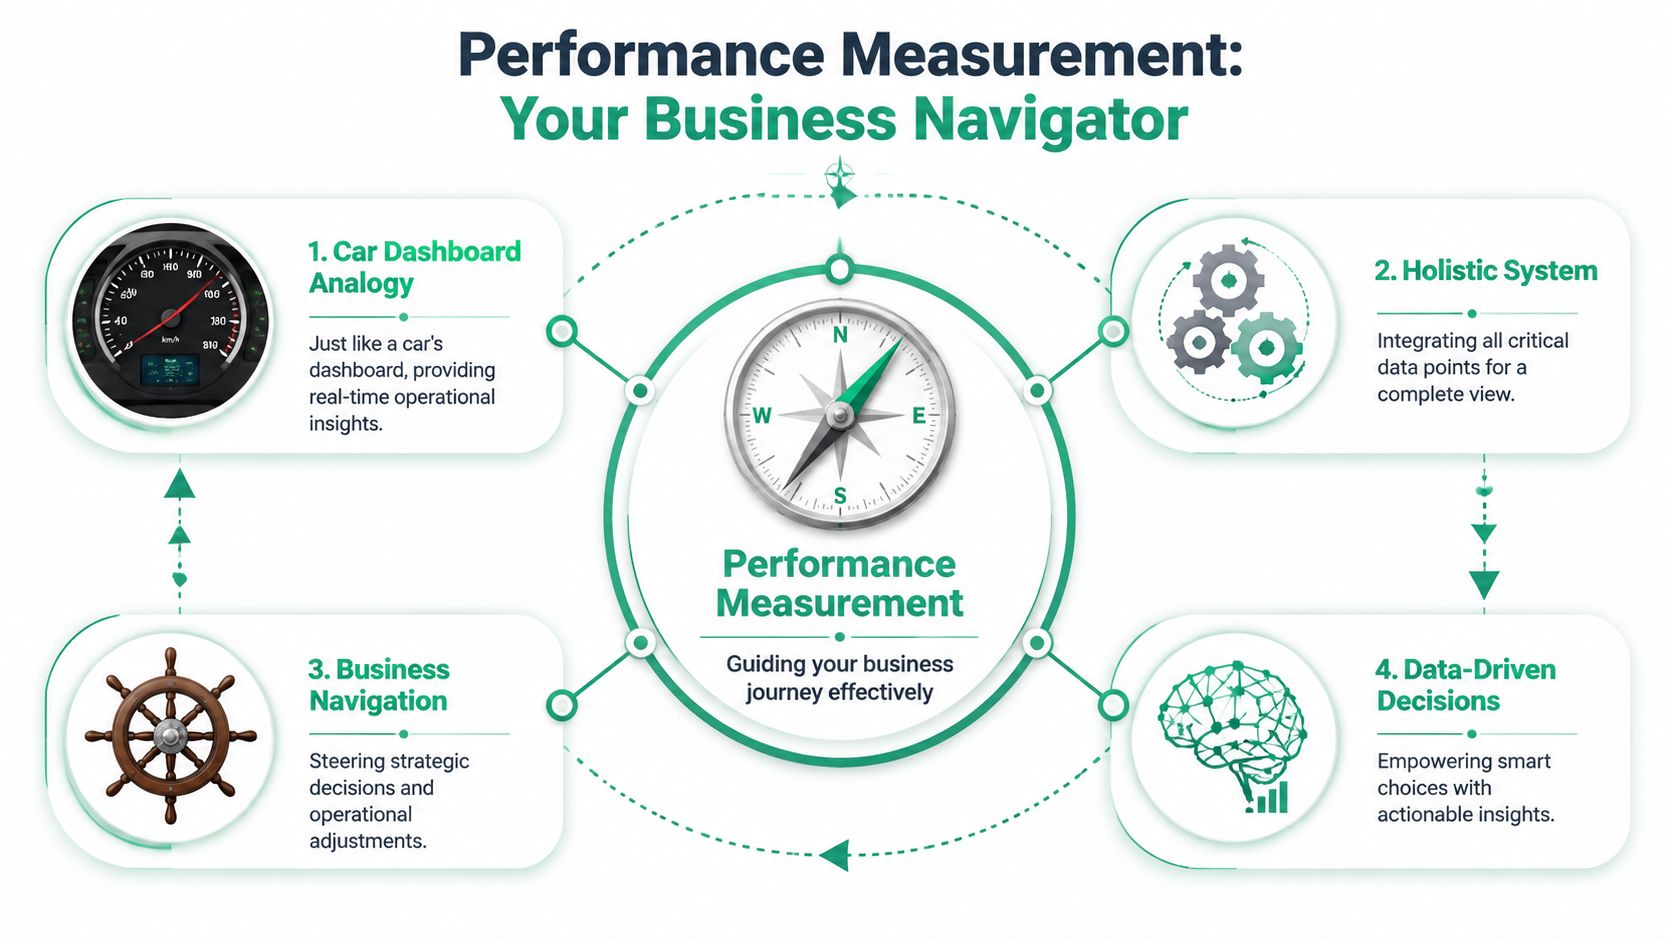
A vehicle's dashboard offers a helpful comparison. Speed matters, but so do fuel level, engine temperature, and route direction. Revenue is your speedometer. Useful, but incomplete. If you only watch sales, you can miss customer churn, fulfillment breakdowns, rising support burden, or team capacity limits until they start hurting the business.
A more reliable model uses a balanced scorecard. That framework integrates four categories of metrics: financial metrics, customer metrics, internal process metrics, and organizational capacity metrics. It gives you a fuller view of performance than revenue alone. The same framework also includes examples such as ROI, gross margin, cost of goods sold, employee productivity rate, error rate, customer satisfaction, brand value, and net promoter scores. It's built to answer practical questions about whether goals are being met, whether resources are being used efficiently, and how strategy is translating into results.
The four views that matter
Here's how those categories show up in ecommerce:
| Category | What it answers | Ecommerce example |
|---|---|---|
| Financial | Are we making money efficiently? | Gross margin, cost of goods sold, ROI |
| Customer | Are buyers getting a good experience? | Satisfaction trends, retention patterns, post-purchase friction |
| Internal process | Where is work getting stuck? | Error rate, workflow cycle time, employee productivity rate |
| Organizational capacity | Can the team support growth? | Absenteeism, turnover, staffing pressure, capability gaps |
That's why clean inputs matter so much. If your order data, support tags, and product records are inconsistent, the dashboard becomes misleading. A solid complete guide to data quality is useful here because bad source data will corrupt even the best KPI framework.
Why revenue-only tracking fails
Revenue-only tracking creates blind spots fast.
A store can grow sales while support becomes more expensive. It can increase order count while quality slips. It can improve conversion while creating avoidable work for operations after checkout. If leadership only sees top-line movement, the business may look healthier than it really is.
Practical rule: If a metric can't explain a business decision, it doesn't belong on the main dashboard.
Performance measurement works when it turns raw activity into business judgment. That means knowing not only what changed, but whether the change was good, sustainable, and worth repeating.
Choosing Your Measurement Framework
Teams don't need more metrics. They need a framework that stops them from measuring random activity.
The cleanest starting point is usually KPIs. They work well for ecommerce because they tie daily operations to business outcomes. The process for selecting them is stricter than often realized. KPI identification and implementation follows six stages: clarifying objectives, choosing the point of measurement, generating potential indicators, assessing validity and feasibility, piloting and refining, and final selection and integration. That sequence matters because it filters out numbers that are easy to collect but useless in practice.
KPIs versus OKRs
KPIs and OKRs serve different jobs.
KPIs track ongoing health. They're ideal for functions that need steady operational control, such as support, fulfillment, merchandising, finance, and retention.
OKRs are better for change initiatives. If the business is launching a self-service edit flow, redesigning returns, or restructuring a support team, OKRs can help focus the team on a short-term objective and a small set of desired outcomes.
A practical distinction:
- Use KPIs when the question is, “Are we operating well?”
- Use OKRs when the question is, “Are we changing something important?”
Quantitative and qualitative measures
Good performance measurement uses both.
Quantitative measures are easier to trend. They include things like overdue invoices, finance report error rate, average workflow cycle time, customer acquisition cost, average deal size, employee turnover rates, time to fill vacancies, absenteeism, utilization rate, and project success rate.
Qualitative measures tell you whether the numbers are hiding friction. In ecommerce, that often means reading support conversations, post-purchase complaints, cancellation reasons, and customer comments about confusing delivery or order-editing experiences.
A team that only uses quantitative metrics usually misses context. A team that only uses qualitative feedback usually struggles to prioritize.
How to choose the right framework for your store
Use this decision filter:
- If your store lacks consistency, start with a small KPI set. You need operating discipline before ambition.
- If teams are shipping major changes, layer in OKRs for those projects.
- If data collection is messy, fix definitions before setting targets.
- If every team reports separately, standardize ownership and cadence before adding more metrics.
What doesn't work is mixing aspirations, vanity metrics, and lagging financials into one dashboard and calling that strategy. A measurement framework should reduce confusion, not formalize it.
Designing an Ecommerce Measurement Strategy
A strong ecommerce measurement strategy follows the customer journey. It doesn't stop at acquisition, and it definitely doesn't stop at checkout.
The practical mistake I see most is this: teams instrument paid media, product views, cart behavior, and conversion with care, then treat post-purchase activity as a support queue problem. That's where profitability leaks out. Shipping edits, contact changes, fulfillment exceptions, and post-order confusion create real operating cost. If you don't measure that layer, you won't manage it well.
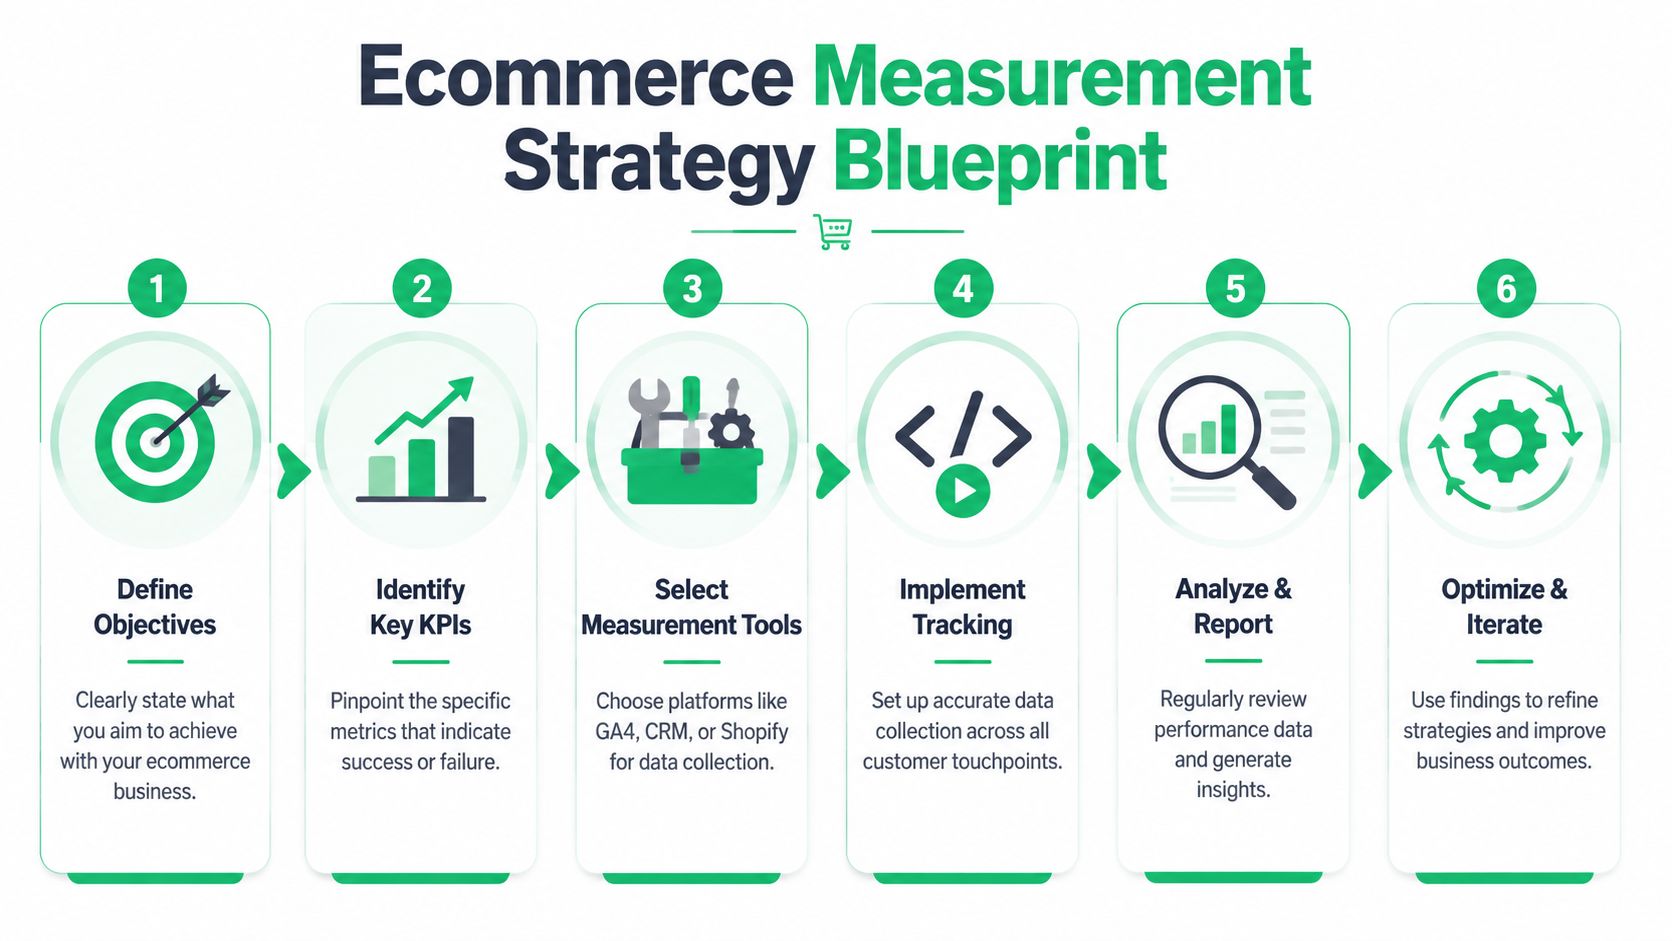
Start with journey-based measurement
Map the business in stages:
Acquisition
Track traffic quality, channel intent, and conversion contribution.Purchase
Watch checkout completion, payment issues, and order mix.Post-purchase
Measure order-change demand, support contact reasons, fulfillment exceptions, and customer effort.Retention
Monitor repeat behavior, complaint patterns, and service-related churn signals.
The point isn't to create a giant map. It's to identify where customer actions create internal work and where internal work affects customer experience.
For teams that need cleaner analytics foundations inside Shopify, this guide to tracking and understanding Shopify analytics for smarter decisions is a practical starting point.
Measure the post-purchase blind spot
One of the most overlooked facts in ecommerce operations is that 40% of ecommerce support tickets stem from post-purchase changes such as shipping and contact edits, according to research cited in the MIT case for the support burden blind spot. That makes post-purchase measurement an operations issue, a support issue, and a customer experience issue at the same time.
Yet many dashboards still don't include a core KPI for ticket reduction rate.
That omission matters. If a store invests in better self-service, improved order communication, or tighter edit workflows, leadership should be able to see whether support demand dropped, whether handling effort changed, and whether customer friction improved. Without that, operations work gets treated like overhead instead of a profit lever.
Post-purchase work is where many stores create hidden cost. If you don't measure demand for changes, you'll keep staffing around avoidable friction.
Build the strategy around controllable actions
A useful ecommerce measurement strategy has to link each metric to a lever the team can pull.
Examples include:
- Support contact reasons tied to clearer order-status communication
- Address-related errors tied to validation and form design
- Workflow cycle time tied to automation or approval rules
- Customer effort tied to self-service availability and page clarity
That structure keeps measurement practical. You're not just reporting what happened. You're identifying where the business can reduce manual work, improve customer satisfaction, and protect margin after the sale.
Essential KPIs for Post-Purchase Workflows
If your store handles meaningful order volume, post-purchase KPIs deserve the same attention as acquisition metrics. Within this context, support cost, delivery friction, and customer trust collide.
The strongest teams benchmark internally first. Strategic performance measurement systems help managers plan ahead and collaborate through benchmarking, and organizations that compare metrics across departments uncover operational inefficiencies that, when addressed, increase revenue per employee and client satisfaction scores, as noted in ACCA's guidance on performance indicators and strategic benchmarking.
The KPIs worth tracking
Below is a practical KPI set for post-purchase operations.
| KPI | What It Measures | Formula / How to Track | Business Impact |
|---|---|---|---|
| Ticket reduction rate | Whether operational changes reduce support demand | Compare ticket volume for targeted issue types before and after workflow changes | Shows whether process improvements are lowering service burden |
| Order edit request volume | Demand for shipping or contact changes | Track tagged support conversations and self-service edit events | Reveals where checkout or post-order communication creates friction |
| Error rate | Quality failures in post-purchase processing | (Total output containing errors / total output) × 100 | Highlights process reliability and cost of rework |
| Average cycle time of workflow | Speed of issue resolution across post-purchase tasks | Measure elapsed time from request creation to completion | Shows where approvals or handoffs slow the team down |
| Employee productivity rate | Output relative to labor input | Total output in units or billable rates divided by total input in time | Helps operations leaders understand workload efficiency |
| Utilization rate | How much employee time is spent generating revenue | Track percentage of time spent on revenue-generating activity | Exposes whether too much team capacity is being consumed by manual service work |
| Customer effort score | How hard customers feel it is to complete a task | Gather structured feedback after order edits, support interactions, or self-service attempts | Connects workflow design to satisfaction and repeat purchase likelihood |
If you want a practical framework for the experience side of that table, this article on mastering customer effort score is worth reviewing.
What separates useful KPIs from vanity metrics
A useful KPI does three things well:
- It points to an owner. Someone can explain the number and act on it.
- It maps to a workflow. The team knows which process affects the result.
- It can be benchmarked. You can compare periods, channels, teams, or issue types.
A vanity metric usually fails one of those tests. “Support activity” is vague. “Number of messages sent” is noisy. “Customer happiness” without a measurement method won't help anyone redesign a workflow.
Include adjacent loss signals
Post-purchase performance doesn't end with edits and tickets. Chargebacks, order disputes, and delivery confusion often share the same root causes: unclear communication, delayed issue handling, and hard-to-fix customer problems. That's why it's useful to keep resources like Disputely's advice on chargebacks in the operating toolkit when reviewing post-purchase friction.
Operator's note: When a KPI rises, ask which team owns the cause, not just which team sees the symptom.
That one habit prevents support from becoming the default container for upstream problems created elsewhere in the business.
Building Dashboards and Reporting Cadence
A good dashboard doesn't try to impress people. It helps them make a decision in under a minute.
That means you should unify the few metrics that explain business health across Shopify, Google Analytics, your helpdesk, finance reporting, and any operational apps handling post-purchase tasks. The dashboard should show leaders where sales are moving, where support burden is rising, and where process quality is slipping.
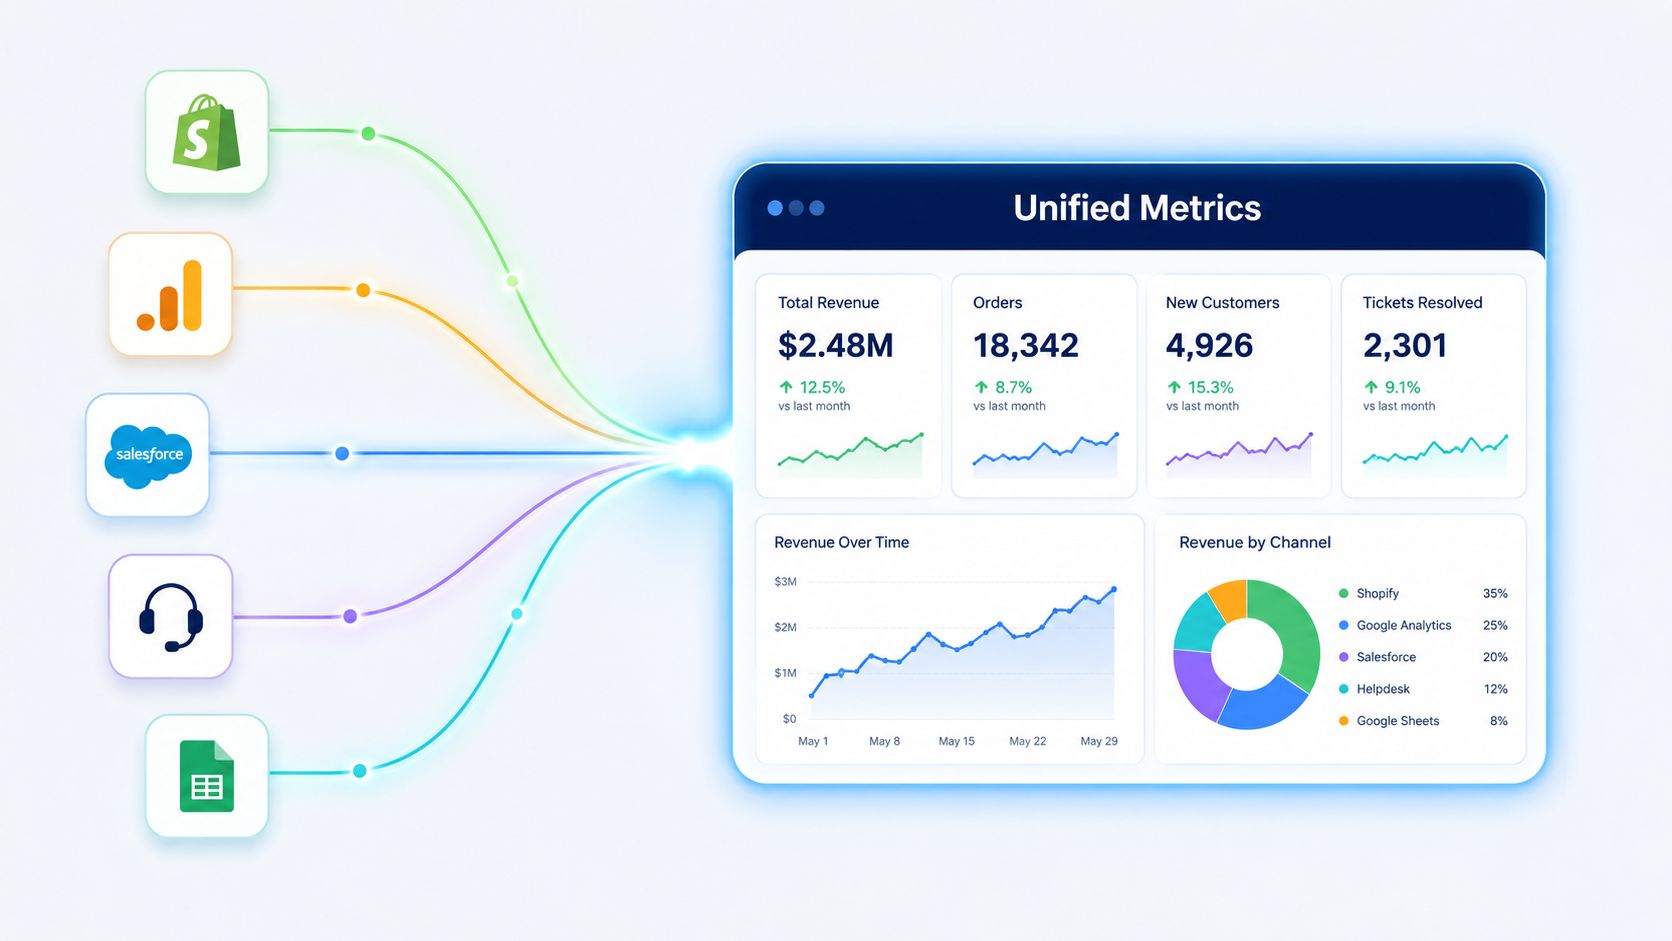
What to put on the main dashboard
Keep the layout simple. I recommend four bands.
Commercial health
Revenue, margin-oriented finance signals, and retention indicators.Customer experience
Complaint themes, satisfaction trends, and customer effort signals.Operational efficiency
Ticket reduction rate, workflow cycle time, error rate, and queue pressure.Team capacity
Utilization, backlog ownership, and unresolved exception volume.
For teams building a cleaner monitoring layer around tools and workflows, this guide to app performance monitoring is useful because dashboard quality depends on reliable system behavior as much as metric selection.
Reporting cadence that people actually follow
Cadence matters as much as design. If you review metrics too slowly, you miss intervention windows. If you review everything constantly, teams tune out.
A workable rhythm looks like this:
- Daily checks for critical failures, exception spikes, and workflow errors
- Weekly reviews for support trends, campaign effects, and process bottlenecks
- Monthly reviews for strategic movement across profitability, customer satisfaction, and capacity
The dashboard is only half the system. The other half is the meeting behavior around it. Every metric should trigger one of three outcomes: continue, investigate, or change something.
A short walkthrough can help teams think about reporting structure in a more operational way:
What reporting should never become
It shouldn't become a slide deck ritual where every team explains why their numbers are complicated.
Use one-page reporting where possible. Flag only the metrics that moved materially or require intervention. If a chart doesn't change a decision, remove it. Teams respect dashboards that save time. They ignore dashboards that demand interpretation without producing action.
Avoiding Pitfalls and Driving Real Action
Most performance measurement systems fail in ordinary ways.
They track too much. They favor what's easy to export over what's useful to manage. They stop at traffic and sales even when customer support and operations are absorbing the cost. Or they produce reports with no owner, no threshold for escalation, and no agreed action when a metric moves.
The common traps
Watch for these patterns:
Vanity-first reporting
Teams celebrate visible numbers like traffic or gross sales while ignoring operational drag after purchase.Metric sprawl
Every team adds charts until nobody knows which numbers matter.No ownership
A KPI appears in a dashboard, but no one is responsible for explaining or correcting it.No qualitative check
A metric looks stable while customers are clearly frustrated in support conversations.
The operating checklist
A tighter approach works better:
- Start narrow with a handful of KPIs tied to profitability, customer satisfaction, and support efficiency.
- Assign owners so each metric has someone responsible for investigation and response.
- Review on cadence so numbers become part of operating behavior, not a monthly surprise.
- Ask “so what?” before keeping any chart on the dashboard.
- Measure post-purchase seriously because that's where avoidable workload often hides.
Good performance measurement doesn't just help you know the score. It helps your team change the system that produced the score.
If your ecommerce business is growing, the next level isn't more data. It's tighter definitions, better operational visibility, and a discipline for acting on what the numbers mean.
If post-purchase support volume is eating into margin and tying up your team, SelfServe gives Shopify merchants a practical way to reduce that burden. It lets customers handle approved order changes themselves, supports multilingual experiences, and helps operations teams streamline edits, reduce avoidable tickets, and create cleaner post-purchase workflows without losing control.