Operational Efficiency Metrics: A Guide for Ecommerce
Support inboxes pile up. Warehouse teams start escalating "small" address issues. Finance sees shipping and service costs drift upward, but no one can point to one root cause. On paper, the business is growing. In practice, the operation feels heavier every month.
That's the moment when most ecommerce teams confuse activity with efficiency. A team can work flat out and still run an inefficient operation if the same preventable issues keep bouncing between support, ops, and fulfillment.
One of the most overlooked examples sits after checkout. Recent 2025 to 2026 data indicates that 30% of post-purchase support tickets stem from customers attempting to modify orders offline, according to CGI's perspective on increasing operational efficiency. That's not just a support problem. It's an operations problem, because every manual order edit pulls time from the same people who should be improving flow, accuracy, and margin.
Teams that scale well treat post-purchase friction as part of their operating system. They don't just optimize the storefront. They clean up what happens after the sale too. If you're reviewing experience and conversion fundamentals, Alpha Omega Digital's ecommerce guide is a useful companion resource because strong operations and strong customer experience usually rise or fall together.
Beyond Busywork to True Operational Efficiency
A busy ecommerce team usually has the same symptoms. Customer service is chasing address changes. Warehouse staff are holding orders for clarification. Someone is exporting spreadsheets to reconcile fulfillment exceptions. Then leadership asks why margins look tighter even though demand is healthy.
That isn't a staffing problem first. It's usually a measurement problem.
Busy isn't efficient
Operational efficiency means the business can produce a reliable outcome with less waste, less rework, and less managerial intervention. In ecommerce, that includes the obvious pieces such as pick, pack, and ship. It also includes the hidden drag created by support-driven order changes, inaccurate addresses, return handling, and disconnected systems.
When teams don't track these issues as operational signals, they normalize them. Manual order edits become "just part of customer service." Repeated shipping corrections become "a warehouse headache." Return-related contacts become "normal ticket volume." None of those labels help you fix the process.
Practical rule: If an issue shows up every week, touches multiple teams, and costs labor to resolve, it belongs inside your operational efficiency metrics.
Why this matters for high-growth brands
Growth magnifies weak workflows. A small brand can survive with a few heroic people solving exceptions by hand. A larger brand can't. The same habits that felt flexible early on start to slow fulfillment, inflate support workload, and make performance harder to predict.
The brands that scale cleanly usually do three things well:
- They quantify friction: They turn recurring problems into measurable KPIs instead of anecdotes.
- They separate symptoms from causes: Rising ticket volume might start with checkout quality, fulfillment delays, or post-purchase rigidity.
- They remove preventable work: They redesign processes so teams stop spending time on tasks customers or systems could handle more cleanly.
This is why operational efficiency metrics matter so much in ecommerce. They give you a way to stop reacting to noise and start identifying key areas for impact. Once you can see where labor, time, and avoidable defects are accumulating, the path to improvement gets much clearer.
What Are Operational Efficiency Metrics
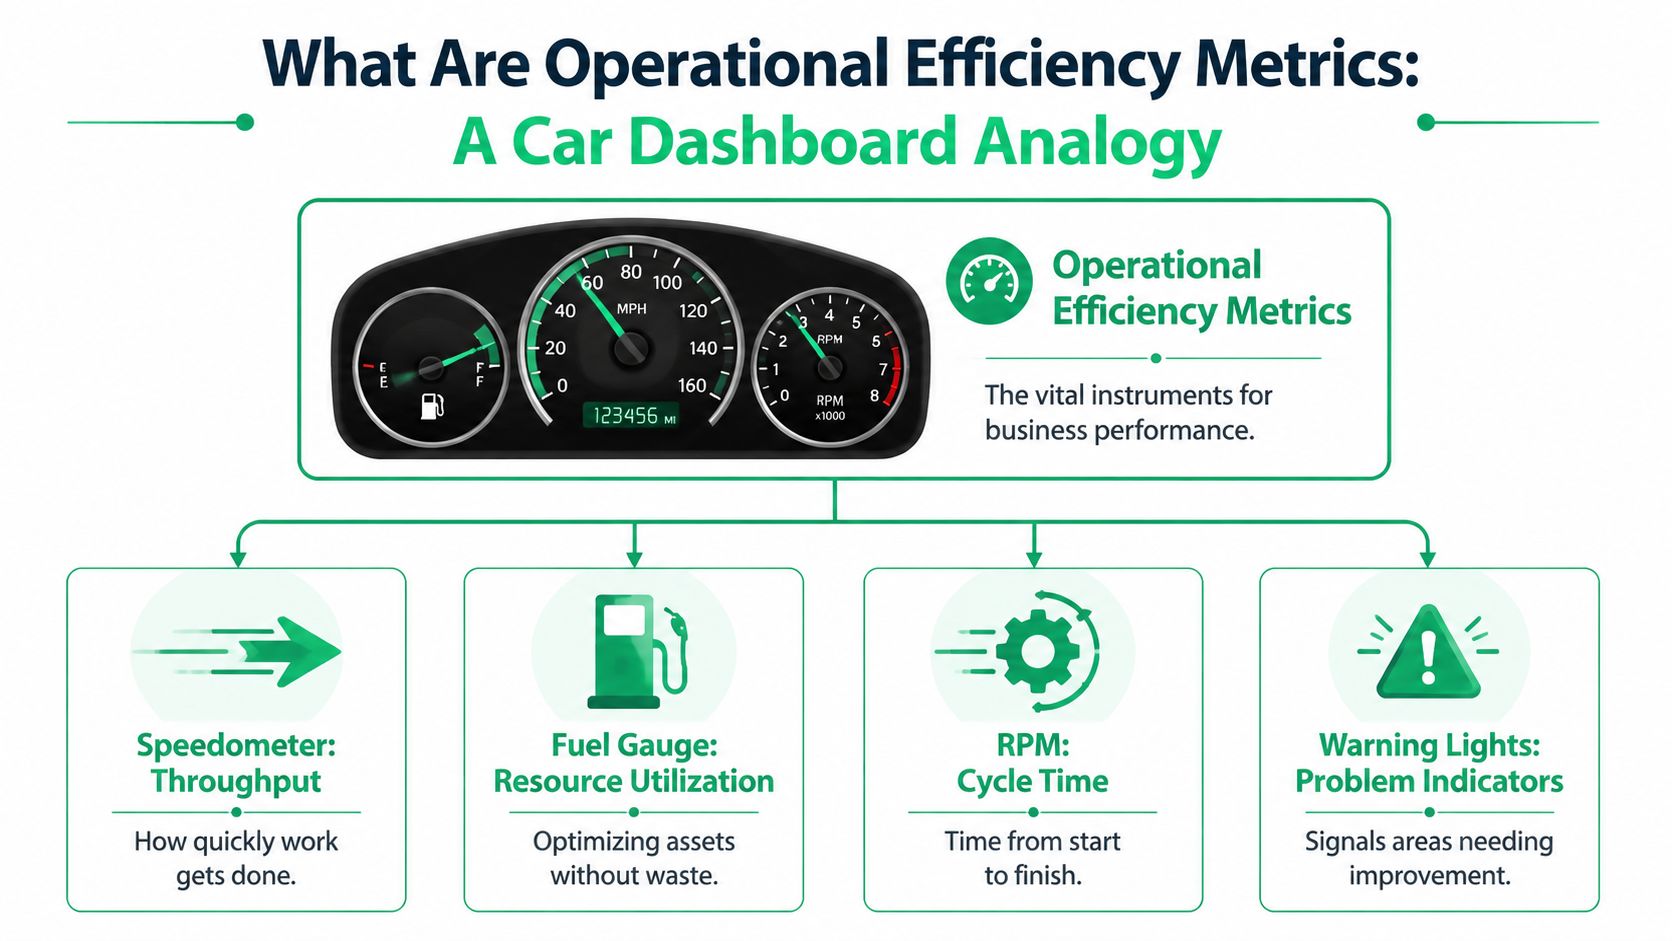
Operational efficiency metrics are the instruments that tell you whether the business is running cleanly or just moving fast. Looking at one KPI in isolation is like driving while watching only the speedometer. You might know how fast you're going, but you'd miss fuel level, engine strain, and warning lights.
The four pillars that matter
A practical way to organize operational efficiency metrics is by grouping them into four business questions.
| Pillar | What it answers | Ecommerce examples |
|---|---|---|
| Cost | What does this process consume? | Cost per order, support cost, return processing cost |
| Time | How long does it take? | Fulfillment time, handle time, resolution time |
| Quality | How often do we get it right the first time? | Order accuracy, address accuracy, defect-related returns |
| Revenue | Does the process protect or expand contribution? | Net sales retained, post-purchase upsell capture, margin preservation |
This framework helps teams avoid a common mistake. They optimize one dimension while damaging another. For example, a warehouse can push speed harder and create more packing mistakes. A support team can resolve tickets quickly but still create back-office rework if manual edits are inconsistent.
The top-line ratio executives care about
At the finance level, one of the clearest measures is the Operational Expense Ratio, calculated as operating expenses divided by revenue. According to JUZ Solutions on measuring operational efficiency, high-performing businesses often target approximately 40% to 50%, while a ratio above 60% can signal that operating costs are growing faster than revenue.
That's why this topic isn't just for operations managers. CFOs care because these numbers show whether the company is scaling with control or adding cost every time volume increases.
A metric is useful only if it changes a decision. If no team knows what action to take when the number moves, it's reporting theater.
Why ecommerce needs a broader view
Traditional efficiency coverage often leans heavily toward manufacturing or finance. Those lenses matter, but ecommerce operations also depend on content systems, customer communication, and post-purchase workflow design. For teams managing complex product catalogs and content-driven buying journeys, Kogifi on enterprise CMS content performance adds a useful perspective on how operational discipline extends beyond the warehouse floor.
In practice, strong ecommerce operations happen when leaders read the whole dashboard. Cost, time, quality, and revenue all move together. If you only monitor one gauge, you'll miss the fault before it becomes expensive.
The 7 Key Metrics for Ecommerce Operations
A useful ecommerce scorecard doesn't need dozens of KPIs. It needs a short list that reflects how orders move, where support labor gets consumed, and how operational friction affects margin.
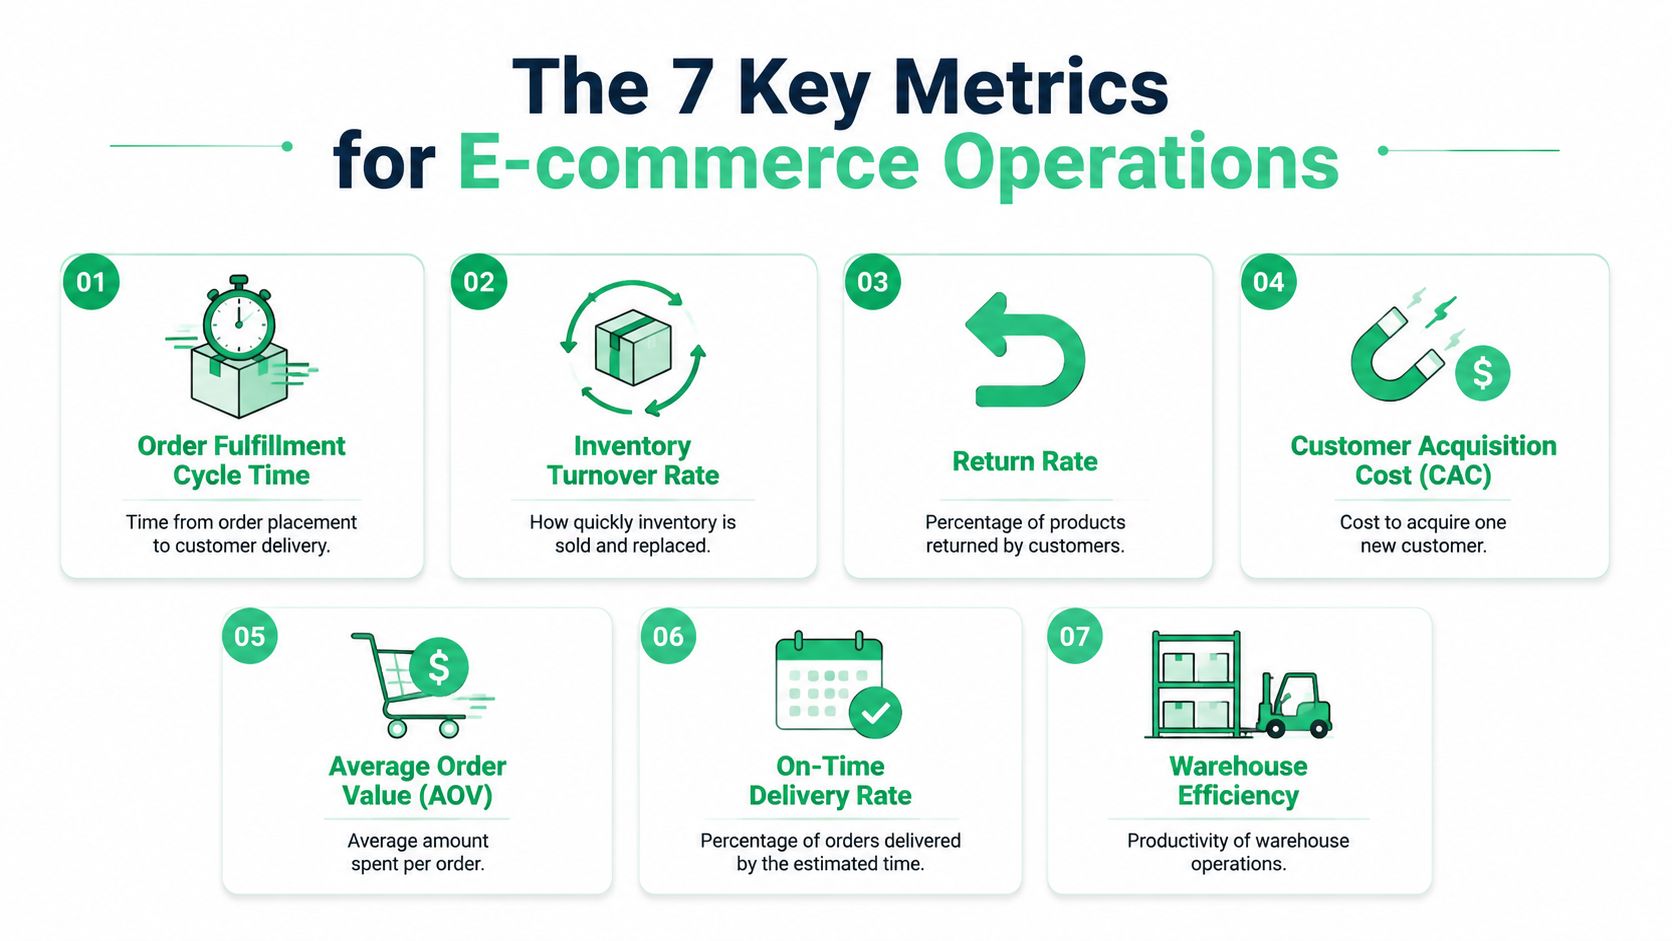
The metrics worth tracking first
Fulfillment time
Formula: order delivered timestamp minus order placed timestamp.
Data sources: Shopify, your 3PL dashboard, carrier events.
What it shows: how long the customer waits and where delays are accumulating.Cost per order
Formula: total fulfillment and service cost for a period divided by total orders in that period.
Data sources: finance system, 3PL invoices, shipping platforms, helpdesk labor assumptions.
What it shows: whether operational cost is rising faster than order volume.Ticket volume per order
Formula: total post-purchase tickets divided by total orders.
Data sources: Gorgias, Zendesk, Shopify.
What it shows: how much support demand your order flow creates.Average handle time
Formula: total support handling time divided by total tickets resolved.
Data sources: helpdesk reporting, support QA tools.
What it shows: how expensive each issue is to resolve.
Here's a useful benchmark concept from broader operations work. Monday.com on operational metrics notes that cycle time is critical for identifying bottlenecks, that reducing cycle time by 20% can lower operational costs by 15%, and that top performers achieve 30% faster cycle times than average. In ecommerce, order processing and exception handling behave the same way. Long delays usually point to a queue, approval step, or manual handoff that needs redesign.
The video below gives another practical lens on how operators approach measurement in live environments.
The quality and revenue side
Order accuracy rate
Formula: correct orders delivered divided by total orders delivered.
Data sources: WMS, return reasons, support tags.
What it shows: how often your operation gets the basics right on the first pass.Returns rate
Formula: returned orders or units divided by total fulfilled orders or units.
Data sources: returns platform, Shopify, ERP.
What it shows: where product issues, expectation gaps, or fulfillment mistakes are creating downstream cost.AOV lift from post-purchase flow
Formula: additional post-purchase revenue divided by total eligible orders, or compare average order value for cohorts exposed to a post-purchase offer versus those not exposed.
Data sources: Shopify, upsell tools, order analytics.
What it shows: whether the post-purchase journey is only a cost center or also a revenue opportunity.- Are fulfillment exceptions driving support contacts?
- Are address-related errors increasing return workload?
- Is rising service effort pushing cost per order upward?
- Are process fixes reducing both labor and customer-facing friction?
- Shopify: order volume, order status, delivery timelines, AOV
- Helpdesk tools such as Gorgias or Zendesk: ticket volume, categories, handle time
- 3PL or WMS: pick errors, on-hold orders, fulfillment aging
- BI layer such as Looker Studio: blended reporting and visual trend lines
Find the broken signal
Start with one metric that clearly moved in the wrong direction. Don't open ten investigations at once. If cost per order rises, that's enough to start.Trace the driver
Break the metric into the operational inputs behind it. Is labor time up, shipping exceptions up, or returns processing up? For this analysis, ticket tags, fulfillment hold reasons, and warehouse notes prove valuable.Change one part of the workflow
Make one targeted adjustment. That could mean changing approval rules, tightening address validation, adjusting pick logic, or rerouting specific ticket types away from manual handling.Watch for confirmation
Recheck the same metric and the leading indicators attached to it. If the leading signal improves but the lagging outcome doesn't, you probably fixed only part of the problem.- Ticket volume falls: fewer customers need an agent for routine edits.
- Average handle time improves: the remaining tickets tend to be more meaningful and less administrative.
- Order accuracy gets stronger: clean customer-entered updates reduce back-and-forth and fulfillment confusion.
- Return and reship risk drops: fewer address and contact mistakes reach the warehouse untouched.
- AOV can rise: post-purchase moments can support relevant add-ons without creating agent workload.
The strongest ecommerce teams don't separate support metrics from ops metrics. They treat every recurring ticket category as evidence about process design.
What works and what usually doesn't
What works is choosing metrics that reveal cause and effect across teams. For example, if ticket volume rises after a carrier service change, or order accuracy slips after a warehouse process update, you can investigate a real operational relationship.
What doesn't work is tracking vanity counts with no operational context. Total tickets alone won't help if you don't know which orders generated them. Fast resolution time alone can mislead if agents are closing tickets quickly but creating fulfillment exceptions behind the scenes.
A solid scorecard should let you answer three questions without debate: where the waste is, who owns the fix, and whether the fix improved the system.
Building Your Operational Efficiency Dashboard
A dashboard should do more than collect charts. It should help your team spot where one weak process is creating cost somewhere else. In ecommerce, that cross-functional view matters because support, warehouse, finance, and retention all feel the same defect differently.
Build around relationships, not departments
A common mistake is creating separate dashboards for each team with no shared logic. Support watches tickets. Ops watches fulfillment. Finance watches margin. Everyone is technically informed, but no one sees the full chain.
A better dashboard starts with linked questions such as:
That structure is what turns reporting into diagnosis.
Leading and lagging indicators
Lagging indicators tell you the outcome. Leading indicators tell you what's about to create that outcome. You need both on one screen.
| Indicator type | Example | Why it matters |
|---|---|---|
| Leading | address edit requests, orders on hold, exception queue size | helps teams act before cost lands |
| Lagging | return rate, support workload, cost per order | shows the financial and service result |
| Diagnostic | ticket reason tags, warehouse error tags, carrier issue tags | explains what changed |
For financial visibility, cost-per-unit logic is useful even outside manufacturing. Runway's guide to operational efficiency metrics for finance defines cost-per-unit as total cost divided by number of units produced and notes that a 5% reduction in cost-per-unit can directly increase profit margins by 3% to 4%. Ecommerce teams can adapt that same thinking to cost per order, cost per shipment, or cost per resolved ticket.
A practical setup for Shopify merchants
A workable first version usually pulls from a few systems:
Keep targets simple. Use trend arrows, threshold colors, and weekly comparisons. Don't over-design the first build. A dashboard that updates reliably and gets used in standups beats a beautiful one nobody trusts.
If you need a good starting point for metric design, this guide to performance measurement in operations is useful because it frames metrics as a management tool, not a reporting exercise.
From Metrics to Actionable Improvements
Dashboards don't fix anything by themselves. They only make weak processes visible. Improvement starts when a team turns a number into a specific operating change.
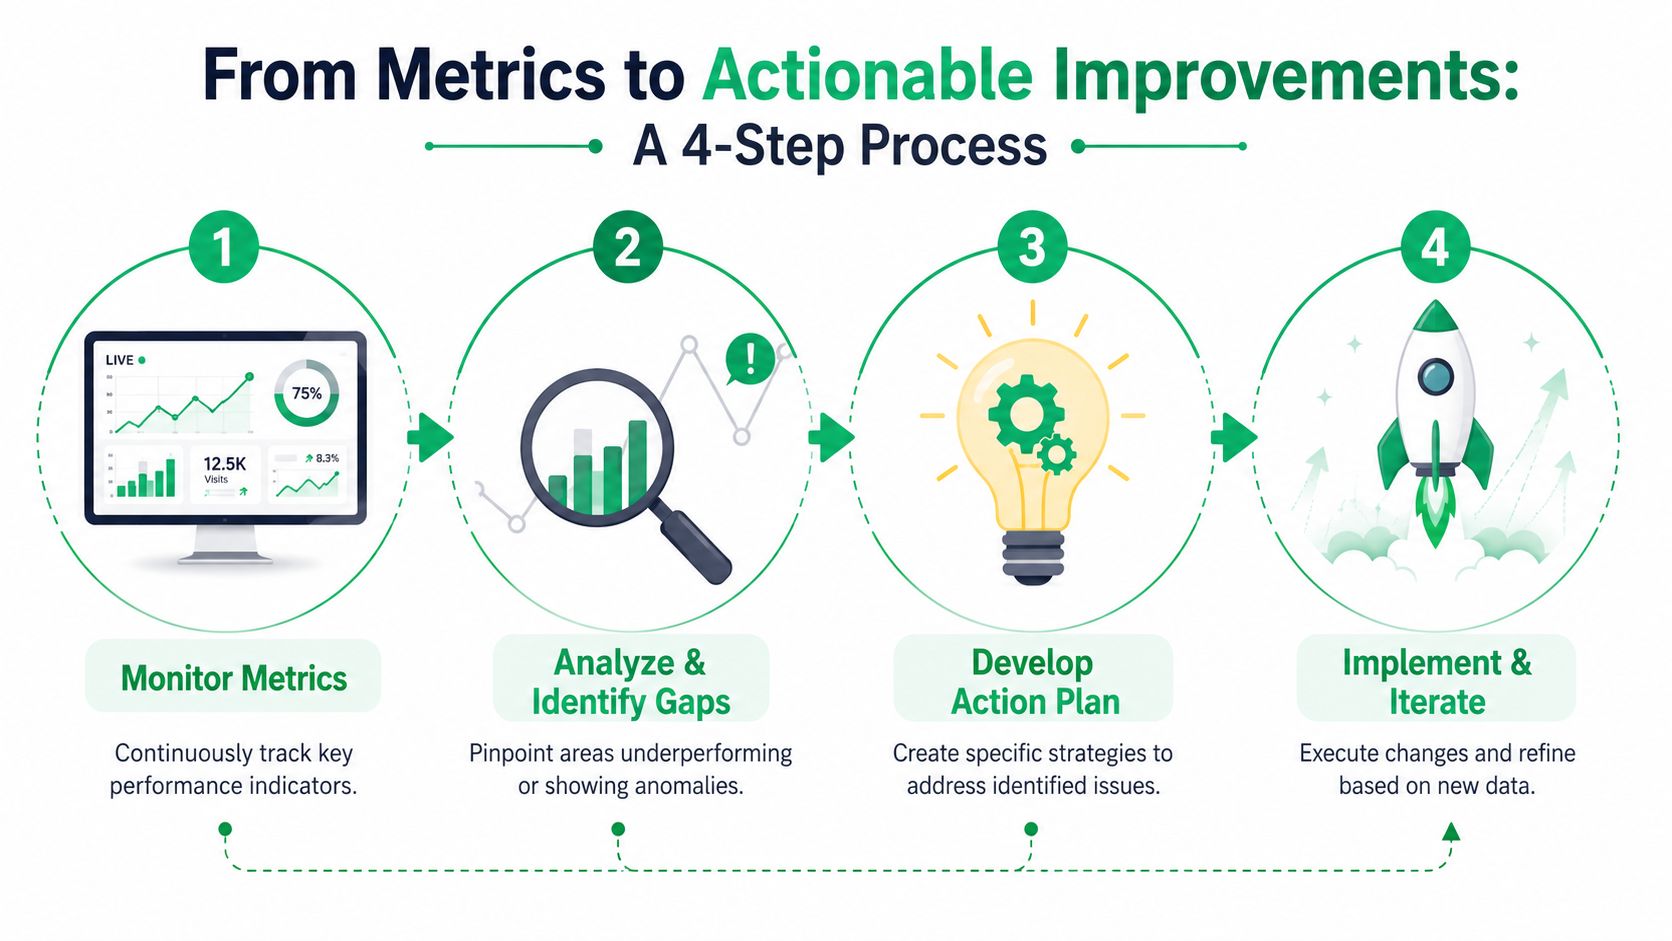
A repeatable four-step process
Key takeaway: Good operators don't ask, “Did we work harder?” They ask, “Did the system require less effort after the change?”
What targeted action looks like in practice
Suppose fulfillment time starts slipping. The wrong response is to tell the warehouse to move faster. The better response is to inspect hold reasons, support-generated edits, and batching rules. If many delayed orders are waiting on manual customer changes, the bottleneck sits upstream.
The same logic applies to support. If average handle time is high, don't assume agents need more coaching. Review the issue mix first. Complex manual requests often inflate handling time more than agent behavior does.
Some teams find it helpful to estimate the value of a process fix before they build it. If you want a lightweight way to think about the financial side, use PEO Metrics' savings calculator as a planning prompt. It's a useful example of translating operational changes into cost terms.
Keep the loop tight
Improvement work gets messy when teams wait too long to review results. Short feedback loops are better. Weekly review is usually enough for fast-moving stores, especially when post-purchase issues can affect the same month's shipping costs and support load.
This is also where operational cost discipline matters. A practical reference for that lens is this article on operational cost reduction, which is useful when you're prioritizing changes that remove recurring labor instead of just shifting work around.
How Customer Self-Service Transforms Efficiency
Most ecommerce teams still think about self-service as a customer experience feature. That's too narrow. It's also an operational design choice.
When customers can resolve simple post-purchase needs on their own within defined rules, the business removes a surprising amount of repetitive internal work. That affects support load, fulfillment flow, and margin protection all at once.
Why post-purchase self-service matters operationally
The largest gains usually come from removing preventable manual work. Address corrections, contact detail updates, and simple order changes often trigger a chain of internal effort. An agent receives the request, verifies eligibility, edits the order, communicates with fulfillment, and then confirms the update back to the customer.
That workflow is expensive because it creates handoffs. Handoffs slow everything down.
For service operations, the key finance view is the Operational Efficiency Ratio, calculated as (OPEX + COGS) / Net Sales. Runn's explanation of operational efficiency notes that top-performing service businesses maintain ratios below 0.50, and that a 5% reduction in the ratio can directly increase profit margins by 3% to 4%. That matters for ecommerce support teams because every manual post-purchase task consumes service capacity that could have been avoided.
What improves when customers handle simple changes themselves
A well-designed self-service flow usually improves operations in several ways:
There's an important boundary here. Not every order change should be open-ended. Strong systems use permissions, time windows, validation rules, and approval logic so customers can do what's safe without creating downstream chaos.
Self-service works best when it removes low-value labor and preserves operational control at the same time.
Support should be treated like a production environment
Support leaders often inherit avoidable work and then get measured on how quickly they process it. That's backwards. A mature ecommerce operation treats repetitive support demand as a defect stream to be reduced, not just handled faster.
That shift changes what teams invest in. Instead of adding headcount every time order volume rises, they improve process design. If you want a strong primer on that model, this overview of what customer self-service means in practice is worth reviewing because it frames self-service as both a customer and operational capability.
Creating Your Continuous Improvement Flywheel
Operational efficiency metrics matter because they turn frustration into something a team can act on. Instead of saying support feels overloaded or fulfillment feels chaotic, you can identify which process is breaking, where the handoff fails, and what to change first.
For ecommerce brands, the biggest missed opportunity is often post-purchase work that nobody treats as an efficiency issue. Manual edits, exception handling, and repetitive service tasks erode margin. Once you measure them as part of the operating system, they become fixable.
Start small. Pick one cost metric and one flow metric. Track them weekly. Tie each to a root-cause review, not just a report. Over time, that habit creates the flywheel every strong operator wants: measure, diagnose, improve, repeat.
If your team wants to reduce post-purchase workload while keeping control over what customers can change, SelfServe is built for that job. It helps Shopify merchants let shoppers manage eligible order edits, supports address validation, and creates cleaner post-purchase workflows that are easier for support and operations teams to manage at scale.