Operations Reporting: Master Shopify Performance

You already know the feeling. Slack is noisy, Shopify is open in one tab, your help desk is open in another, and someone has shared a dashboard full of neat trend lines that don't answer the only question the team cares about right now: what needs attention today?
That's the failure point in most operations reporting. The business isn't short on charts. It's short on reports that help support leads, fulfillment managers, and ecommerce operators decide what to fix before a small issue becomes a backlog, a refund, or a missed delivery window.
For Shopify merchants, there's a second problem. Most reporting setups still treat post-purchase activity like a side note instead of an operational lever. If customers are editing orders, fixing addresses, or canceling without agent intervention, that should show up as reduced workload, lower friction, and a clearer ROI story. Usually it doesn't.
Why Your Current Operations Reports Are Failing You
Most operations reports fail for one simple reason. They measure activity, not relief.
A dashboard tells you ticket volume is up. Fine. It doesn't tell you whether the increase came from preventable address issues, late carrier scans, warehouse misses, or a promo that created a weird spike in order edits. It definitely doesn't tell you whether a post-purchase tool absorbed work that would otherwise have landed on your support queue.
More data usually makes the report worse
Teams often assume the solution is to add more widgets, more filters, and more KPIs. That usually creates a reporting graveyard. People stop trusting it because none of it is tied to action.
The gap is especially obvious in ecommerce. Existing operational reporting content focuses heavily on real-time dashboards and KPI tracking, but it misses the important step of integrating post-purchase self-service events into reports so teams can quantify support workload reduction and prove ROI. It also doesn't explain how to map those small customer actions to higher-level metrics like tickets per order or handling time saved, as noted in Orbit Analytics' guide to operational reporting.
Practical rule: If a metric doesn't help someone change staffing, process, automation, or exception handling, it probably belongs in a different report.
Vanity metrics look busy, not useful
I've seen teams obsess over dashboard freshness while ignoring whether the dashboard answers operational questions. A live chart of gross sales can be useful for leadership. It won't help your support team understand whether order edit requests are dropping because your post-purchase flow is working, or because customers gave up and opened tickets somewhere else.
Useful operations reporting links a business event to an operational consequence. For Shopify stores, that means tracing actions like:
- Address changes: Did self-service edits reduce avoidable support contacts?
- Order cancellations: Are customers resolving simple requests without an agent?
- Post-purchase add-ons: Did upsells create extra fulfillment complexity or smooth order consolidation?
- Contact detail edits: Did cleaner customer data reduce failed deliveries and follow-up work?
If your current setup doesn't connect those events to cost, time, and queue pressure, it's incomplete.
A good starting point is to tighten how you read store data in the first place. This guide on tracking and understanding Shopify analytics for smarter decisions is useful because it pushes beyond surface-level store metrics and toward decisions operators can act on.
The real test
The best operations report answers a hard question quickly: which tool, workflow, or failure point changed the team's workload this week?
If your report can't answer that, it isn't helping operations. It's just documenting motion.
What Is Ecommerce Operations Reporting
Monday at 10:15 a.m., support is buried in address-change tickets, fulfillment is holding orders that should have shipped an hour ago, and the only dashboard leadership can see is revenue by channel. That is the gap operations reporting is supposed to close.
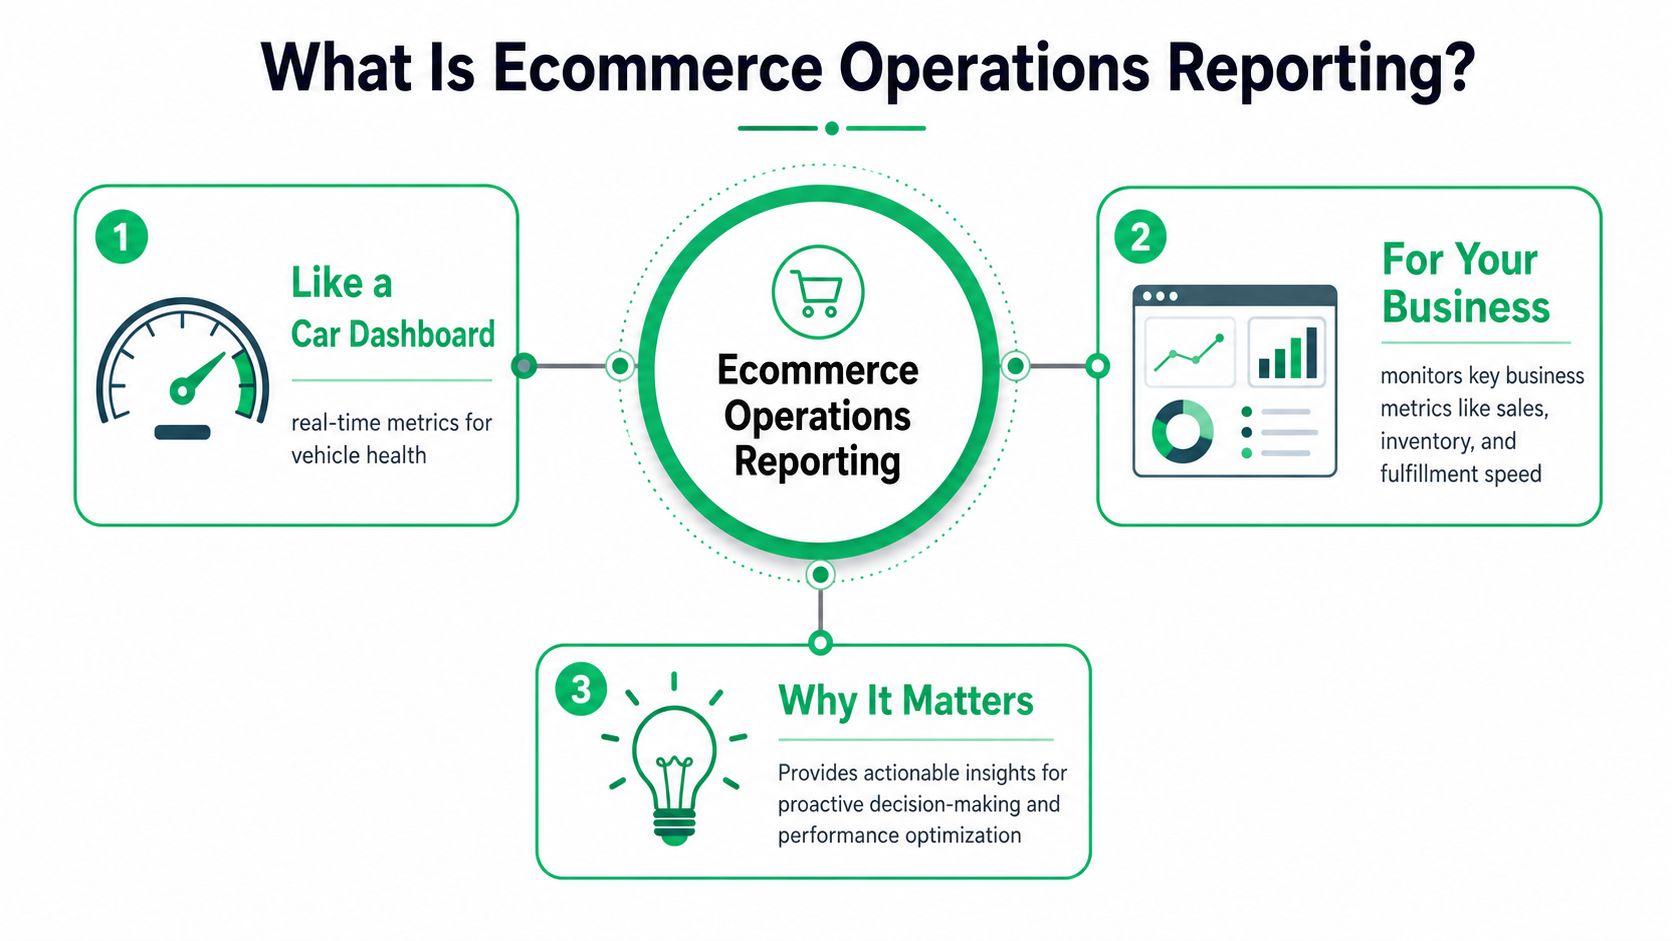
In ecommerce, operations reporting is the system operators use to track workload, exceptions, and process stability while orders are still moving. It focuses on what the team needs to act on now: queue pressure, aging work, avoidable manual touches, and whether a workflow change resulted in reduced effort. FanRuan's overview of operational reports gets the broad distinction right. These reports are built for immediate decisions, not retrospective storytelling.
What it looks like in practice
For a Shopify merchant, a good operations report sits closer to the floor than the boardroom. It shows where work is piling up, what changed this week, and which issues are consuming paid team time that should have been automated already.
That includes measures like:
- Support queue health: New tickets, backlog aging, repeat contacts by issue type
- Fulfillment flow: Orders waiting to pick, stuck exceptions, holds created by post-purchase edits
- Delivery risk: Invalid addresses, failed corrections, shipment delays tied to bad customer data
- Post-purchase self-service performance: How many address edits, cancellations, or contact-detail changes customers completed themselves versus how many still became tickets
That last category is where generic reporting advice falls apart. If you use a post-purchase tool such as SelfServe, the report should show whether self-service actions reduced support workload, shortened handling time, or prevented fulfillment interruptions. Otherwise, the tool gets judged like a cosmetic app instead of an operational one. The whole point is to connect product usage to labor saved.
What it is not
Operations reporting is different from strategic reporting because the decision window is different. Strategic reports help leadership assess trend direction, margin, channel mix, and growth over time. Operations reports help support leads, warehouse managers, and ecommerce operators decide whether to reassign coverage, change a rule, pause a workflow, or fix a broken handoff today.
A strategic report can tolerate lag. An operations report cannot.
Teams also blur operations reporting with activity reporting. Logging that 300 customers opened a self-service portal is not enough. Operators need to know how many completed a change successfully, how many still created tickets, and whether the workflow reduced downstream work. The Live View Pro for defining metrics article is useful here because reporting systems fail fast when teams never agree on what counts as a resolution, delay, or prevented ticket.
The standard for a report worth keeping
A report earns its place if it changes behavior. In practice, that means it helps the team spot a problem early, route work to the right queue, or prove that a process change cut manual effort.
The third use case matters more than many teams admit. Shopify operators buy automation and self-service tools to reduce repetitive contacts and protect fulfillment capacity. Reporting has to prove that happened. A clean way to frame that is through operational efficiency metrics for ecommerce teams, especially metrics tied to ticket deflection, handling time, and exception reduction.
If a report cannot show whether post-purchase self-service removed work from support and fulfillment, it is not operations reporting. It is status wallpaper.
The KPIs That Actually Matter for Operations
The KPI list that matters in operations is usually shorter than the KPI list teams maintain. That's a good thing.
You don't need every available metric from Shopify, your help desk, your 3PL, and your post-purchase tools. You need the handful that reveal strain, waste, and avoidable manual work. If a metric can't trigger a staffing change, workflow change, or automation change, it probably belongs in a different dashboard.
Pick KPIs that force a decision
Good operational KPIs answer a specific question:
- Do we need more coverage on support today?
- Is fulfillment slowing because of volume or exceptions?
- Are delivery issues coming from bad data or carrier problems?
- Is self-service reducing support workload?
If your metric doesn't lead to one of those decisions, it's probably reporting trivia.
A lot of teams also get stuck because they never define terms cleanly. If your support lead and ops lead disagree on what counts as a resolved issue or a fulfillment delay, your dashboard will start fights instead of ending them. This breakdown from Cart Whisper on Live View Pro for defining metrics is worth reading because metric definitions are where many reporting systems fail.
Essential Ecommerce Operational KPIs
| KPI | What It Measures | Primary Stakeholder |
|---|---|---|
| Tickets per 100 Orders | Support demand relative to order volume | Support Manager |
| First Contact Resolution Rate | Whether agents solve issues without repeat contact | Support Manager |
| Self-Service Deflection Volume | Customer issues handled without agent intervention | Ecommerce Operations Manager |
| Unfulfilled Order Aging | Orders sitting too long before fulfillment | Fulfillment Lead |
| Exception Order Queue | Orders blocked by address errors, edits, or manual review | Operations Manager |
| Pick and Pack Throughput | How fast the warehouse is processing orders | Warehouse Manager |
| Orders Held for Address Review | Delivery risk caused by incomplete or questionable data | CX Operations Lead |
| SLA at Risk | Work likely to miss internal or external service targets | Team Lead |
| Cancellation Request Type | Whether cancellations are routine, fraud-related, or preventable | Operations Manager |
| Repeat Contact by Issue Category | Whether the same operational failure keeps generating support work | Support Manager |
The metrics I'd prioritize first
Not every store needs the same KPI stack, but most Shopify merchants should start here:
- Tickets per 100 Orders: This gives you cleaner context than raw ticket volume. Support may look busier because order volume is up.
- Exception Order Queue: This catches operational drag early. If exceptions are growing, fulfillment usually feels it before leadership notices.
- Self-Service Deflection Volume: Post-purchase reporting gains utility here. You need a count of customer actions completed without an agent.
- Unfulfilled Order Aging: This separates “busy warehouse” from “stuck workflow.”
For teams trying to tighten execution, this guide on operational efficiency metrics is a helpful reference because it keeps the focus on metrics tied to process performance instead of vanity reporting.
What doesn't deserve top billing
Some metrics look impressive and still don't help.
- Total dashboard views: Nobody cares.
- Generic order volume charts: Useful context, weak operational signal on their own.
- Average response time without issue segmentation: Often misleading.
- Top-line revenue in an ops report: Leadership metric, not an operator's control panel.
If a report makes the team say “interesting” instead of “do this next,” it's not an operations report.
Building Your Operations Reporting Workflow
A reporting workflow falls apart when it starts with visualization instead of data design. Teams rush into a dashboard tool, build attractive charts, then realize the underlying systems don't agree on definitions, timing, or ownership.
That's why the first job isn't building a dashboard. It's deciding which events matter, where they live, and who needs to act on them.

Start with systems, not screens
A practical Shopify operations reporting workflow usually pulls from four buckets:
- Commerce data from Shopify, including orders, tags, edits, cancellations, and fulfillment states
- Support data from your help desk, including ticket reason, resolution status, and handling flow
- Logistics data from carriers or 3PL platforms
- Post-purchase event data from the apps and workflows customers interact with after checkout
That last bucket gets missed all the time. If customers are correcting addresses, requesting changes, or canceling through self-service, those events belong in your reporting model. Otherwise, you can't connect customer actions to support workload changes.
Integration is where most teams struggle
This isn't just a merchant problem. Data fragmentation is still a major barrier to usable operations reporting. Despite data quality improvements being linked to an estimated $5.5 trillion in global value from 2000 to 2019, 86% of enterprise IT leaders still rank integrating data across systems as a top priority, according to Gitnux coverage of operating statistics. That tells you something important. Most reporting pain isn't caused by lack of data. It's caused by scattered systems and mismatched definitions.
Field note: If Shopify says one thing, the help desk says another, and the 3PL says a third, operators stop trusting all of them.
Build the workflow in a sensible order
Use this sequence:
- Define the operational question first: Example, “Did self-service address edits reduce support contacts for incorrect shipping details?”
- List every required event: Order placed, edit requested, edit completed, ticket created, ticket reason, fulfillment hold, shipment exception.
- Assign a system of record: Don't let the same event be “owned” by three platforms.
- Normalize timestamps and IDs: Order ID mismatches ruin more reports than bad charts do.
- Set reporting cadence by urgency: Real-time for stockouts or fulfillment holds. Daily for support trends. Weekly for ROI review.
- Decide who sees what: Frontline leads need exception views. Leadership needs rollups with operational consequences.
If your store is still wrestling with disconnected order workflows, it helps to review how a Shopify order management system should structure order states and downstream processes before you try to report on them.
Reporting cadence should match actionability
Not everything deserves a live dashboard.
A stockout alert or fulfillment block needs immediate visibility. A weekly rollup of self-service edits versus related support tickets is often more useful than a live ticker because it shows pattern, not noise. Teams often overbuild in this context. They make every metric real-time, then wonder why nobody can tell what matters.
The cleanest reporting workflow is usually boring. Clear event capture, consistent ownership, steady cadence, and exception visibility. That's what operators use.
Shopify Operations Reporting Template in Action
The fastest way to improve operations reporting is to stop thinking in dashboards and start thinking in event chains.
Take one common Shopify scenario. A customer places an order, notices the shipping address is wrong, and fixes it through a self-service post-purchase flow instead of emailing support. That one action should not disappear into app logs. It should become operational evidence.
To visualize the flow, use a simple process model like this:
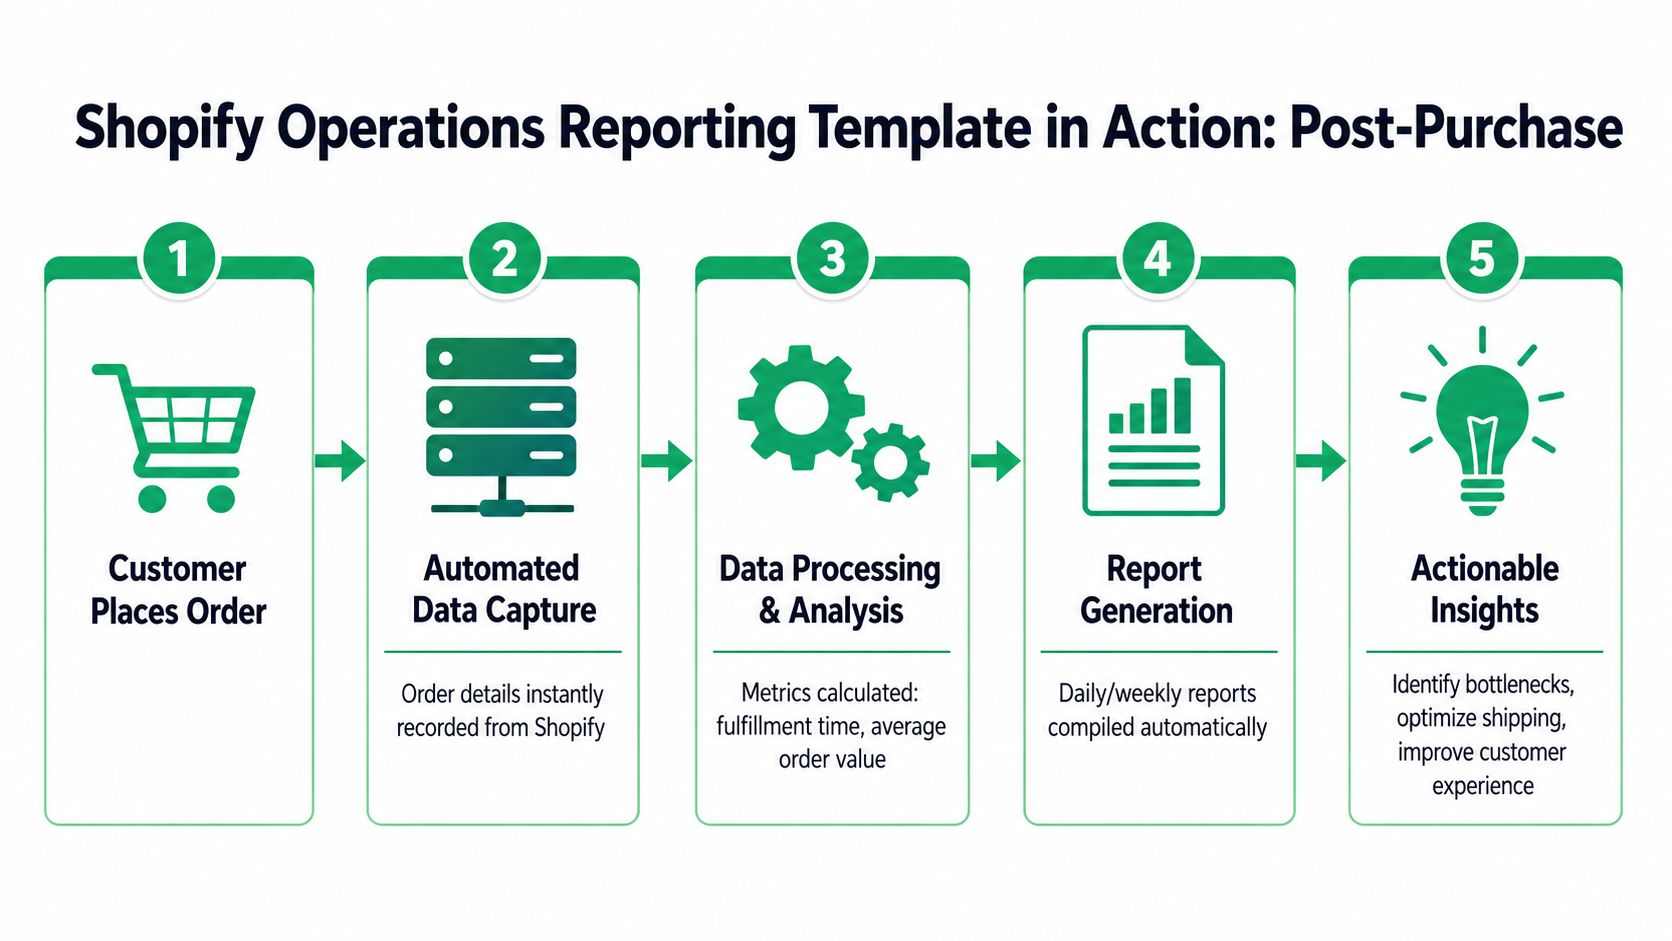
One customer action, one measurable operational outcome
Here's the event chain worth tracking:
- Customer places an order
- Customer identifies an address mistake
- Customer completes a self-service address edit
- System records the edit against the order
- No support ticket is created for that issue
- The order proceeds with cleaner shipping data
That chain matters because it converts a customer action into an avoided support task.
In high-volume ecommerce, reducing support ticket volume through self-service post-purchase editing is directly correlated with a 30 to 40% reduction in average handling time, and when customers validate shipping details themselves through real-time Google Maps integration, error rates drop by over 25%, according to Visme's operational reporting article. For operators, the point isn't the headline. It's what to do with it.
Turn the event into a reporting template
Your template doesn't need to be fancy. It needs to be traceable.
Use a weekly report with three layers:
Event layer
Capture the raw customer actions:
- Completed self-service address edits
- Completed self-service contact edits
- Customer-initiated cancellations
- Orders flagged after failed address validation
Operational layer
Map those events to workload indicators:
- Incorrect address tickets
- Tickets per order
- Average handling time for address-related tickets
- Orders placed on manual review because of address issues
Decision layer
Answer only the questions leaders and team leads care about:
- Are customers resolving routine issues themselves?
- Is support spending less time on repetitive post-purchase requests?
- Are bad addresses creating fewer downstream problems?
- Should we expand self-service permissions or tighten them?
Don't ask the report to prove everything. Ask it to prove one operational improvement clearly.
A short video walkthrough can help teams align on how this process should look in practice:
What the report should actually say
A useful weekly note might read like this:
Customers completed self-service address updates this week. Related support demand for incorrect-address issues was lower, and agents spent less time on routine verification work. The main operational gain came from removing repetitive back-and-forth before fulfillment.
That's a real operations insight. It links customer behavior, support workload, and fulfillment stability.
Where most merchants go wrong
They log the self-service event, then stop there. That creates app analytics, not operations reporting.
The missing step is attribution. Every self-service event should be mapped to the issue category it likely prevented. That doesn't require fake precision. It requires disciplined tagging and consistent issue taxonomy. If support tickets use one set of labels and post-purchase tools use another, you'll never prove impact.
This is the same reason strong reporting setups in other channels rely on clean event architecture. For example, teams working with retail media often use deeper source data, such as the Amazon Ads API for CPG brands, to connect tactical events to business outcomes instead of relying on surface dashboards.
The template to keep
Build one mini-report around one self-service action first. Address edits are usually the cleanest starting point because the operational consequence is obvious. If that works, extend the same model to cancellations, contact changes, and post-purchase upsells.
That's how you prove ROI in operations. Not with a giant dashboard. With a chain of evidence.
Best Practices and Common Pitfalls to Avoid
Most operations reporting problems aren't technical. They're discipline problems. Teams track too much, define too little, and publish reports nobody owns.
The fix is usually less glamorous than people want. Cleaner inputs. Fewer metrics. Sharper decisions.
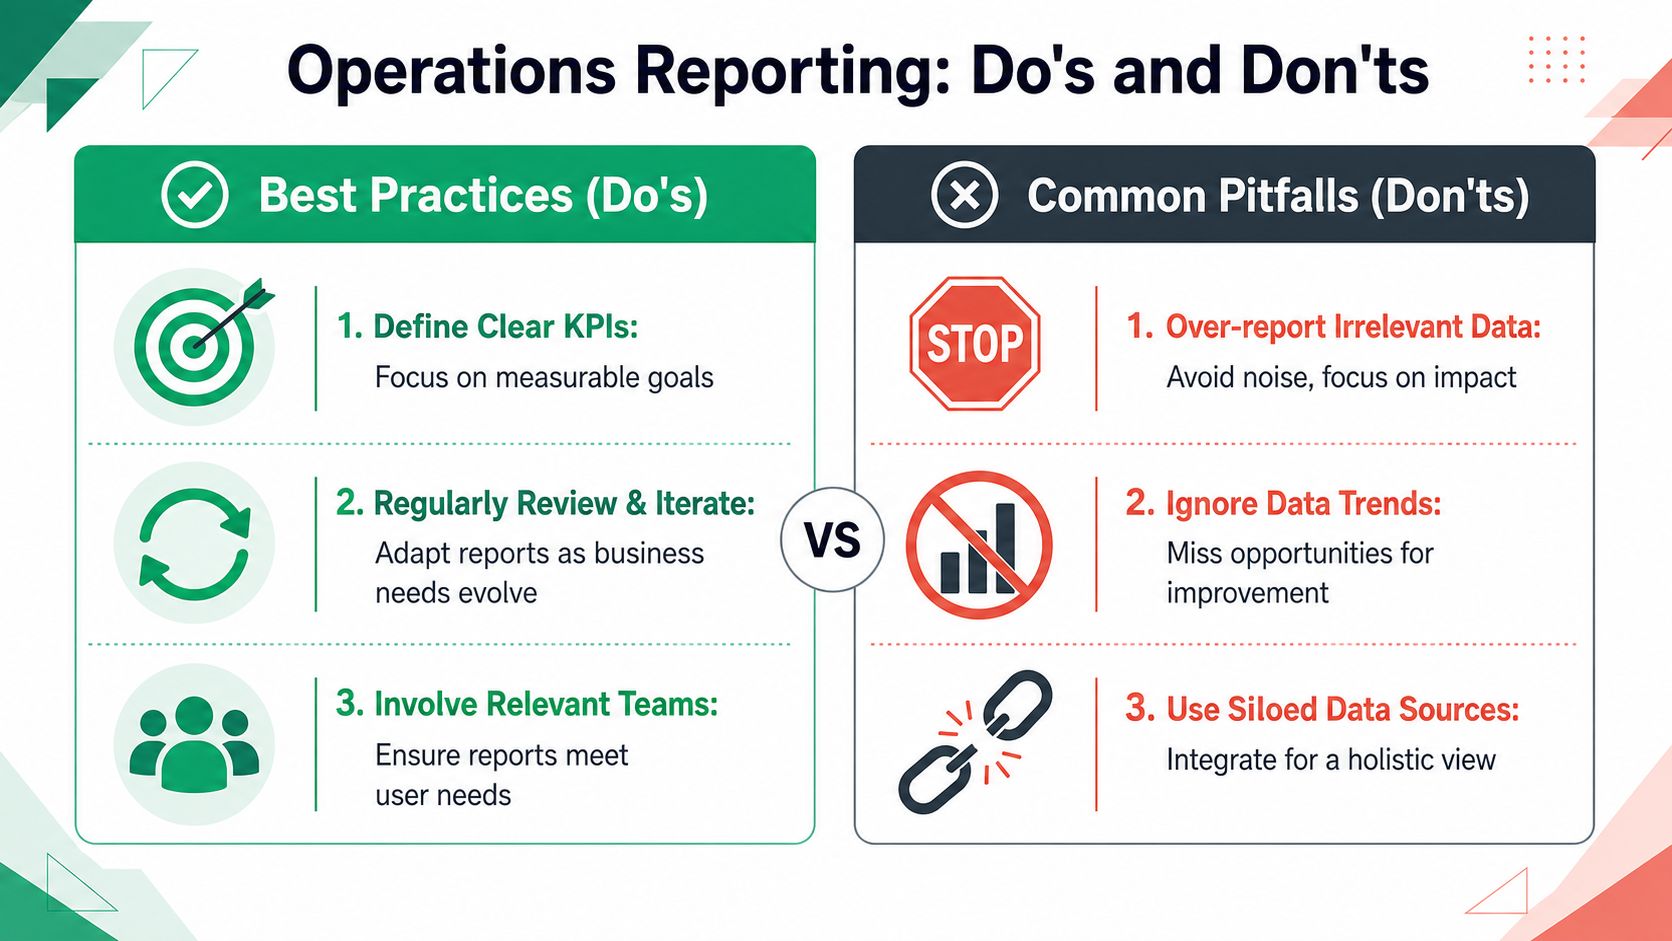
What to do
- Start with one painful workflow: Address changes, cancellations, or fulfillment exceptions are better starting points than a giant cross-functional scorecard.
- Track leading indicators: Queue growth, exception counts, and self-service completion events matter before lagging outcomes show up in customer complaints.
- Tie each KPI to an owner: A metric with no owner becomes dashboard wallpaper.
- Use consistent labels: Support issue categories and post-purchase event types need to line up.
- Review reports on a fixed rhythm: Reports only become useful when a team meets around them and changes something.
What to stop doing
- Stop chasing vanity metrics: High-level traffic and broad sales graphs won't solve operational friction.
- Stop mixing strategic and operational views: One report can't do every job well.
- Stop tolerating siloed data definitions: If fulfillment, support, and ecommerce ops calculate the same thing differently, the report is already compromised.
- Stop building reports without response rules: If a threshold gets crossed and nobody knows what to do next, you built a dashboard, not an operating tool.
The best report is usually the one a team can act on in five minutes, not the one that took three weeks to design.
A quick operator checklist
Use this before you launch or revise any operations report:
| Check | What good looks like |
|---|---|
| Purpose | One clear decision the report supports |
| Audience | Named team leads or operators, not “everyone” |
| Inputs | Defined systems of record for each event |
| Metrics | Small set of KPIs tied to workflow changes |
| Cadence | Matched to urgency, not preference |
| Response | Clear action when a metric moves the wrong way |
The trap to watch for
The most common pitfall is reporting on what's easy to export rather than what's useful to manage.
Shopify, your help desk, and your apps can all produce data. That doesn't mean they're producing management insight. Operations reporting starts working when you force every metric to justify its place.
From Data Chaos to Operational Clarity
Useful operations reporting isn't about having the most data. It's about connecting the right events to the right decisions.
For Shopify merchants, that means treating post-purchase behavior as operational data, not just app activity. If customers are fixing addresses, changing contact details, or resolving routine issues without an agent, that belongs in your support and fulfillment reporting. Otherwise, you're hiding one of the clearest sources of ROI in the business.
The simplest next step is also the most effective. Pick one manual support task that happens constantly. Address changes are a good candidate. Track the customer event, track the related ticket category, and review the relationship every week. Keep the report small. Keep it tied to action.
That's how teams get out of data chaos. Not by adding more charts, but by making each report prove something operationally useful.
If your team wants to reduce support workload while giving customers more control after checkout, SelfServe is built for that job. It helps Shopify merchants let customers edit shipping and contact details, manage cancellations, and add post-purchase upsells within defined rules, so operations teams can cut repetitive tickets and make the impact visible in reporting.