Revenue Analytics: Boost AOV & Cut Support Load
You're probably staring at a Shopify admin tab, a support inbox, and a spreadsheet full of order edits, and none of them agree with each other. Sales look fine on paper, but you can't tell whether upsells are truly lifting revenue, whether address fixes are preventing failed deliveries, or whether support is eroding margin. That's where revenue analytics becomes useful, not as another report, but as a way to connect booked sales, post-purchase changes, and operational outcomes in one view.
For Shopify merchants, the biggest mistake is treating revenue as a single number. Modern revenue analytics tracks the full path from purchase to retention, and benchmark guidance for 2026 places median MRR/ARR growth at 26%, NRR at 110%–120% for strong performance, and 125%+ as world-class, which shows how much weight the discipline puts on growth quality, not just volume (benchmark guidance). In ecommerce, the same mindset helps you see where order edits, upsells, and support interventions change realized revenue after checkout.
Introduction to Revenue Analytics
A lot of Shopify merchants feel profitable until the month ends and the numbers get messy. An order got edited, a customer canceled, an address was corrected after support stepped in, and a thank-you-page upsell added a few more dollars, but none of that sits neatly in one report.
Revenue analytics solves that by pulling those fragments into one operating picture. Instead of looking at sales, upsells, and order edits as separate events, you measure them as parts of the same revenue system. That matters because post-purchase operations can create real revenue leakage when they're invisible.
The practical payoff is simple. When you can quantify what changes after checkout, you can improve AOV, cut avoidable support load, and spot revenue loss before it becomes a pattern. The sections below walk through the core metrics, attribution choices, Shopify setup, and dashboard design that make that possible.
Understanding Revenue Analytics
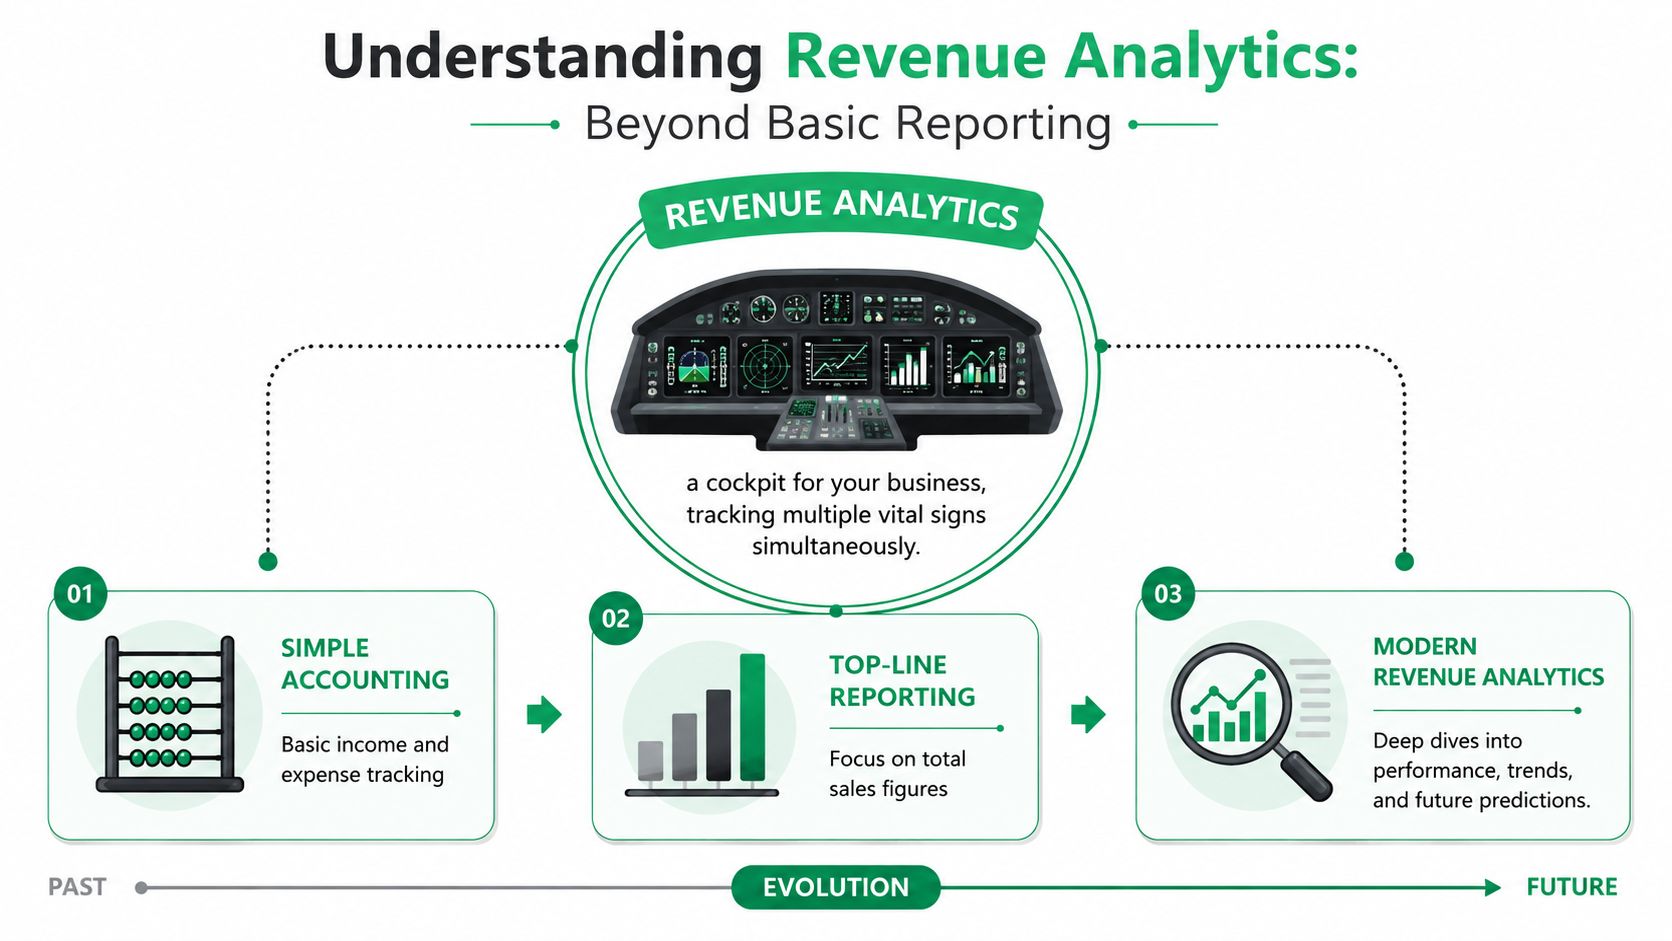
Think of revenue analytics like a cockpit dashboard. A pilot doesn't want just speed, or just altitude, or just fuel. They need all three at once, because the plane only makes sense when the instruments are read together.
That's the shift revenue teams made as subscription and recurring-revenue businesses expanded. The field became more valuable when analysts needed to track revenue over time rather than only at the point of sale, and today the standard metric stack includes MRR, ARR, NRR, GRR, churn, CAC, and LTV (historical overview). In plain English, the focus moved from “what did we sell?” to “what keeps compounding, what leaks, and what costs too much to acquire?”
From reporting to prediction
Basic reporting tells you what already happened. Revenue analytics asks why it happened, what's likely to happen next, and what action should follow when a metric changes. That's a big difference for Shopify merchants, because an upsell module, a changed shipping address, or a cancellation queue isn't just an operational detail, it's a revenue event.
Practical rule: if a workflow can change cash collected, margin protected, or support time spent, it belongs in revenue analytics.
That's also why the discipline matters more in ecommerce than many merchants realize. A sales dashboard can say the order was placed, but it won't tell you whether a post-purchase change saved the sale or created new work. Once you start reading those signals together, your dashboard stops being a scorecard and starts becoming a decision tool.
Key Metrics and Data Sources
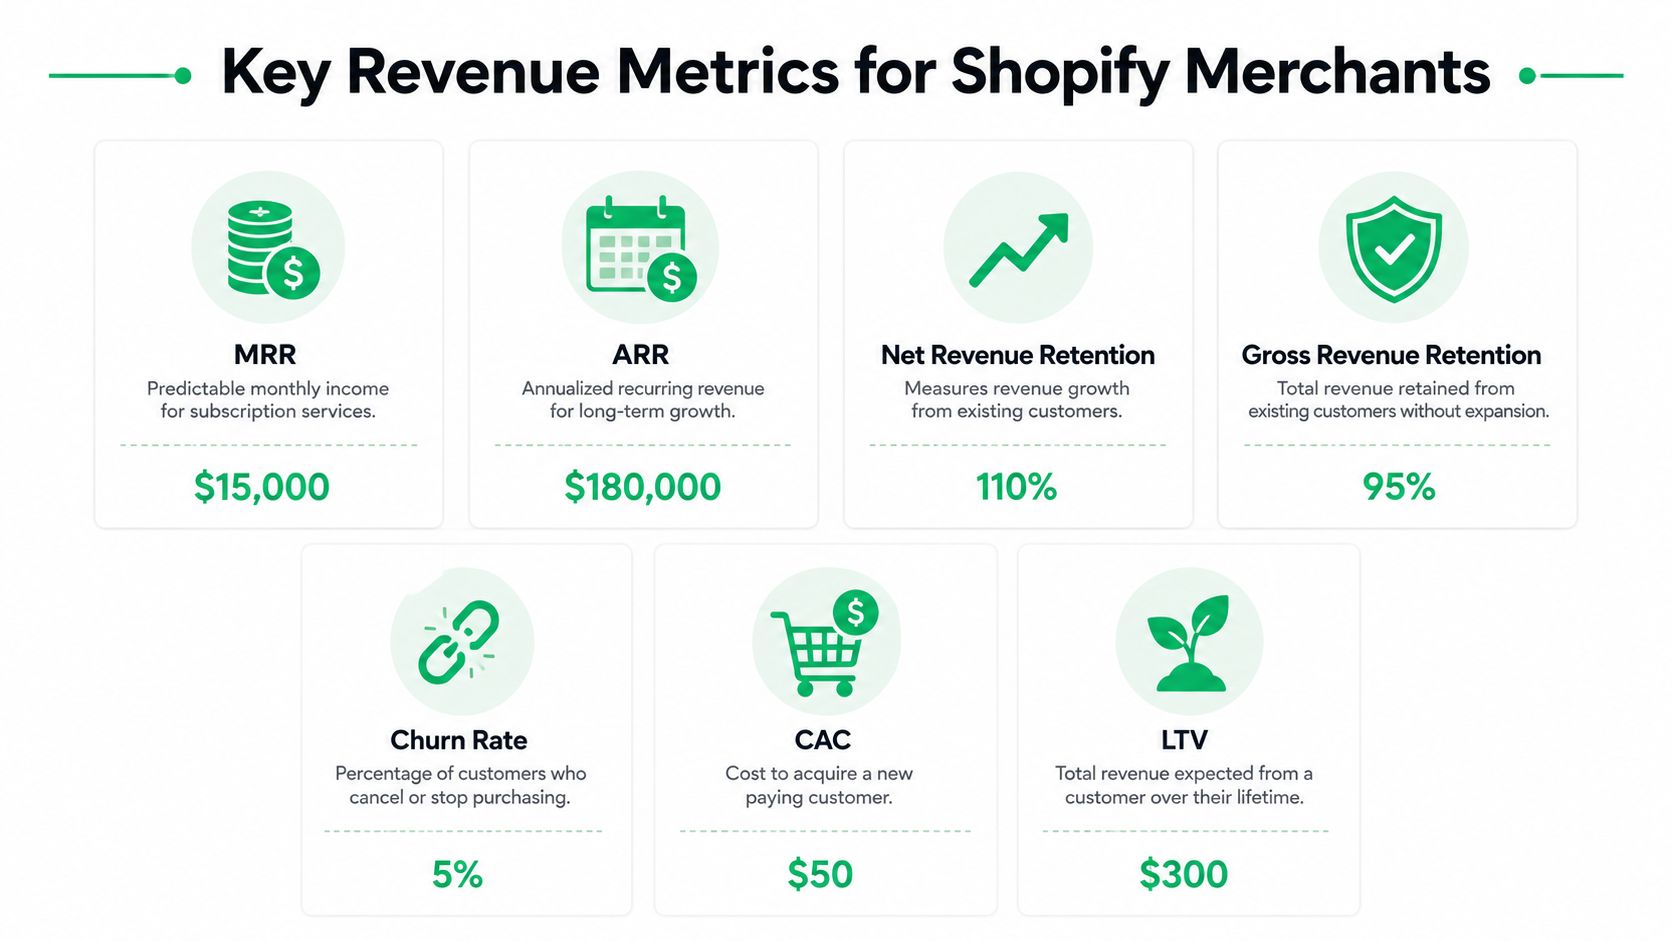
The core metrics are familiar, but each one answers a different question. MRR and ARR show recurring revenue run-rate, NRR shows how much revenue you keep and expand from existing customers, GRR shows how much you retain before expansion, churn shows what's slipping away, CAC shows what it costs to acquire a customer, and LTV shows the long-term value of that customer (2026 benchmark guidance). For Shopify merchants, the important mental shift is that these measures are not competing truths, they're different lenses on the same business.
The benchmark context also helps you interpret those numbers. Current guidance places median MRR/ARR growth at 26%, NRR as strong at 110%–120% and world-class at 125%+, GRR above 90% as a strong floor, monthly churn below 3%–5% for B2B SaaS, CAC payback at 15–18 months, LTV:CAC at 3:1 to 5:1, Magic Number above 0.75, and ARR per employee at $129,724 (same benchmark set). You don't need those exact thresholds to run an ecommerce store, but they show the logic: revenue analytics ties growth, retention, and efficiency together.
Where to pull the data
Shopify gives you the starting point, native sales reports for gross order value, discounts, refunds, and channel performance. From there, you layer in order-edit logs, upsell events, and support-related changes from the tools that capture them. If your store uses post-purchase widgets, tag every event with the order ID, customer ID, and timestamp so the numbers line up later.
A useful habit is to treat data quality as part of the metric, not an afterthought. Real-time address validation, consistent tags for order changes, and synced reporting across Shopify and Google Analytics reduce the chance that you'll count the same revenue twice or miss the revenue that never made it into the order total.
For a practical adjacent reference on how another analytics layer works, the X analytics guide is a good example of how event-level activity gets turned into a readable performance view.
A simple source map
- Shopify native reports: use these for sales, refunds, discounts, and channel-level order value.
- Order-edit logs: use these to identify changed shipping details, address corrections, and cancellation-related changes.
- Upsell tracking: use this to isolate revenue added after checkout.
- Google Analytics: use it to connect campaign traffic and revenue paths.
- CSV or API exports: use these when you need to join Shopify records with external reporting tools.
Measuring and Attributing Revenue
Attribution gets messy fast in ecommerce because not every dollar comes from the same moment. A customer might click an ad, buy, accept an upsell, and then edit the order after checkout. If you only assign credit to the last click, you miss the revenue created by the store experience itself.
Choosing the right attribution lens
First-touch attribution gives all credit to the first interaction. Last-touch attribution gives all credit to the final interaction before purchase. Those are simple, but they flatten the customer journey. Revenue-weighted attribution is more useful when you care about the whole chain, because it spreads credit across acquisition, upsells, and post-purchase edits according to their actual contribution.
That matters because post-purchase and service operations are still under-covered in most revenue analytics coverage. Changes, cancellations, failed address validation, and support-driven exceptions can all erode margin or create preventable leakage after checkout (post-purchase leakage gap). If you don't include them in your model, you'll over-credit the campaign and under-credit the operational fix.
A practical formula for Shopify
Use a simple structure:
Attributed revenue = original order revenue + upsell revenue - refunded revenue + retained revenue from saved edits
That formula isn't a universal accounting rule, but it's a practical analytics frame for merchants who want to see realized value, not just booked value. If a support agent corrects an address before shipment, the saved order can count as protected revenue in your internal dashboard. If a customer adds products through an order-edit upsell, that's incremental revenue that should sit beside the original sale, not buried in a separate report.
Revenue analytics gets useful when you stop asking, “What did we sell?” and start asking, “What did we actually keep?”
The hardest part is consistency. Pick one attribution rule for acquisition, one for upsells, and one for post-purchase edits, then document them in the dashboard so your team doesn't argue about the number every Monday.
SelfServe operations reporting is a helpful internal example of how post-purchase activity can be organized into a measurable workflow without turning the shop floor into a spreadsheet project.
Implementing Revenue Analytics on Shopify
Start with the data you already have, then add the missing events one layer at a time. In Shopify, that means sales reports first, then order-edit records, then upsell events, then support or logistics exceptions. If you try to build the whole system at once, you'll spend more time cleaning data than using it.
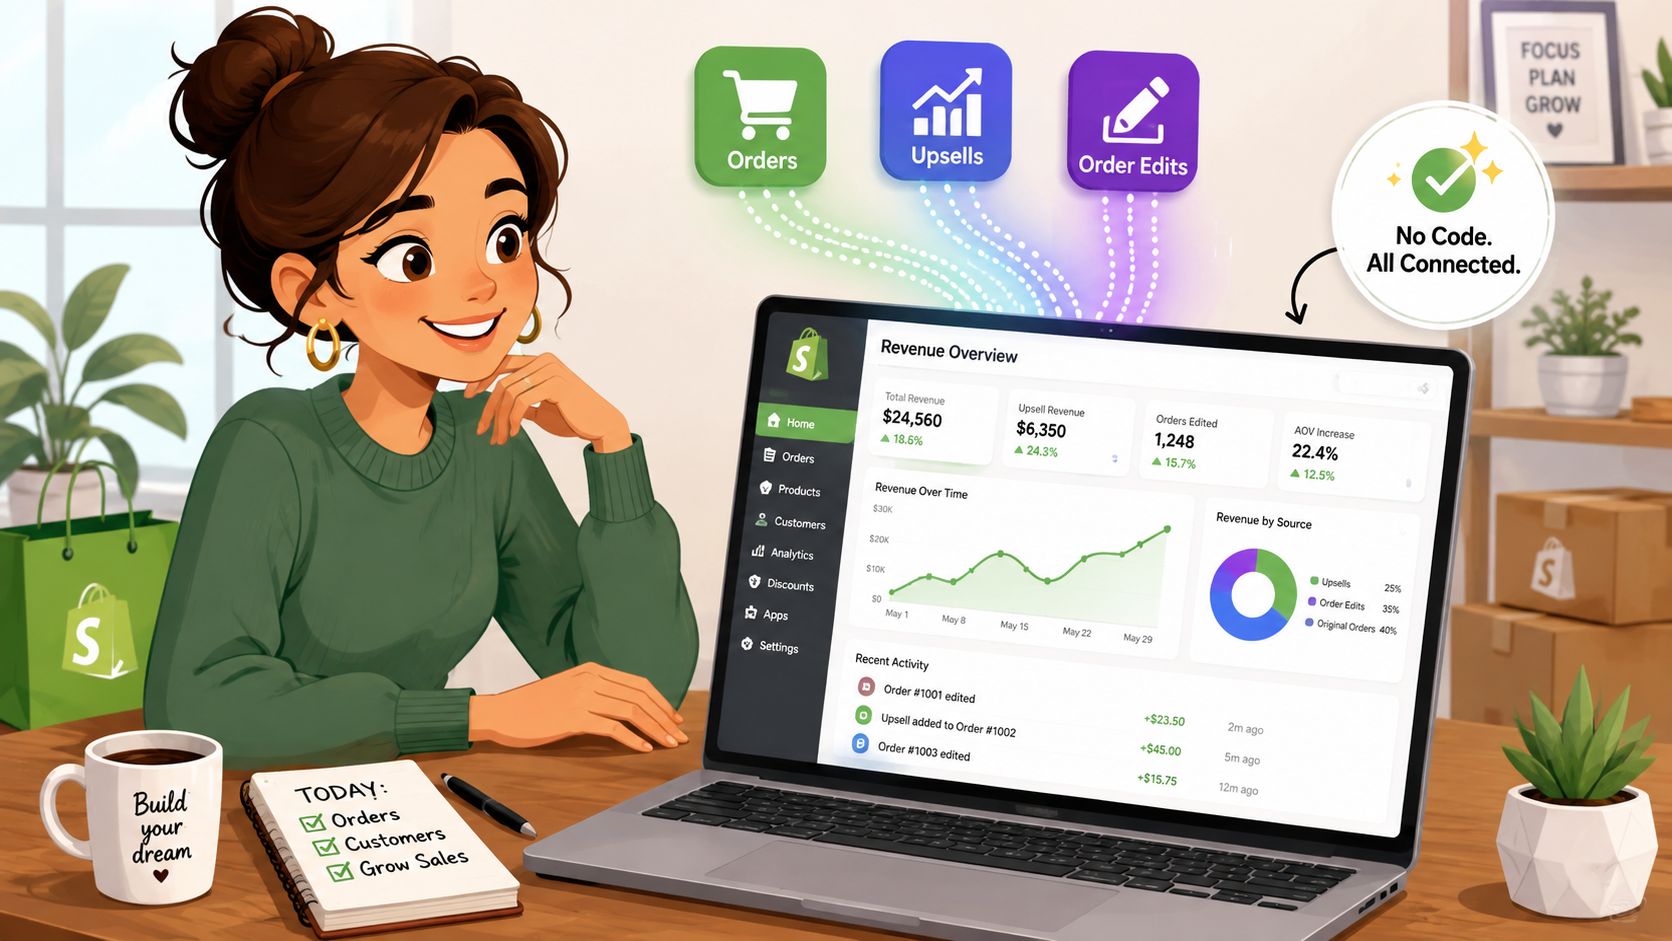
The cleanest setup is usually a three-part stack. Shopify provides the transaction truth, a post-purchase app captures order changes and upsells, and a reporting layer or BI tool joins everything by order ID. That structure keeps your analytics understandable even if your store runs multiple themes, markets, or languages.
Setup steps that keep the data usable
- Define the event list. Separate original purchase, upsell acceptance, address correction, cancellation, and manual edit into different event types.
- Tag every event. Use consistent labels so edits and upsells can be tied back to the original order.
- Set permission windows. Decide when a shopper can still edit shipping or contact details, and keep that rule consistent.
- Sync reporting sources. Export Shopify data and combine it with external reports through CSV or API connectors.
- Validate before launch. Check that one order appears once, not three times, after you combine sources.
If you're using Google Analytics, connect it to revenue funnels so your acquisition data and post-purchase data speak the same language. If you also have multilingual customers, make sure the widget and messages adapt cleanly so language friction doesn't become an invisible support problem.
The Shopify analytics setup guide is a useful internal reference if you want a practical walkthrough of turning store data into something your team can read without opening five tabs.
What good implementation looks like
A strong setup doesn't just collect more data. It reduces ambiguity. Your team should be able to answer which orders were edited, which ones gained upsell revenue, which ones needed support help, and which workflows caused unnecessary touches.
Use Cases and Dashboards for AOV and Support Load
A useful dashboard doesn't try to show everything. It shows one decision at a time. For Shopify merchants, the two dashboards that usually matter most are the AOV view and the support-load view, because both connect revenue directly to operational behavior.
AOV before and after upsells
The first dashboard should compare average order value across two windows, before and after an upsell launch. Add filters for product category, customer segment, market, and traffic source so you can see whether the lift is real or just a seasonal blip. If the upsell offer performs well only for one segment, that's still useful, because it tells you where to keep the module on and where to turn it off.
Support tickets against edited orders
The second dashboard should track weekly support ticket volume next to edited-order counts. If edits rise while tickets stay flat, your self-service flow is probably working. If both rise together, the workflow may be creating confusion instead of convenience.
Decision rule: alert on a drop in AOV or a spike in support load only after you've split the data by segment, otherwise you'll chase noise.
Many teams often stay stuck in lagging reporting. The better move is to treat analytics as decision automation, because industry guidance keeps pointing out that the last mile between insight and action is still thinly documented, especially for ecommerce teams (lagging vs leading indicators gap). If AOV falls, the offer changes. If edited orders spike, the permission rules tighten. If support load rises after checkout, the workflow needs a fix.
| Use Case | Metric Tracked | Impact |
|---|---|---|
| Upsell launch review | AOV | Shows whether the offer raises order value |
| Post-purchase workflow review | Edited-order count | Shows how often shoppers change orders |
| Support efficiency review | Ticket volume | Shows whether self-service reduces contacts |
For a tactical example of how one merchant-facing workflow can be framed, the AOV optimization guide shows why the connection between order edits and revenue lift belongs on the same dashboard.
Conclusion and Next Steps
Revenue analytics is not just about bigger sales reports. It's about seeing the full path from acquisition to upsell to order edit, then deciding which events create value and which ones leak it. When Shopify merchants measure those flows together, they get a clearer picture of AOV, support load, and real revenue retained after checkout.
The next moves are straightforward. Review your core metrics, choose one attribution model for acquisition and one for post-purchase events, build dashboards that separate upsells from edits, and test alerts for revenue drops or support spikes. Keep the setup simple enough that your team will use it.
If you want better visibility into post-purchase behavior without adding more manual reporting, the fastest path is to build a workflow that ties revenue events back to the order itself and keeps support out of the spreadsheet maze. That's the difference between tracking sales and managing revenue.
SelfServe helps Shopify merchants measure post-purchase changes, upsells, and order edits in one place, so revenue analytics connects directly to daily operations. If you want to reduce support workload and see where revenue is gained or lost after checkout, visit SelfServe and start turning those hidden events into a clearer dashboard.