Subscription Business Model Metrics: Subscription Business

Your Shopify dashboard says sales are up. Recharge or your subscription app says active subscribers look steady. Finance sees cash coming in. Yet when you ask a simple question, "Is our subscription program getting healthier?", the answers get fuzzy fast.
That's the trap with subscription businesses on Shopify. Total revenue can climb while the subscription engine underneath gets weaker. A one-time promo can hide churn. A big acquisition month can cover retention problems. A jump in average order value can make recurring revenue look stronger than it is, even when subscribers are canceling after their first or second order.
For most Shopify Plus brands, the problem isn't lack of data. It's mixed data. Subscription revenue sits next to one-time revenue. Support issues live in helpdesk tools. Address problems show up in operations. Upsells get measured as merchandising wins, not retention levers. The result is a business that looks understandable from far away and confusing up close.
The solution is to track the appropriate subscription business model metrics in a way that matches how DTC brands operate. That means measuring recurring revenue separately, watching churn as both a customer problem and an operational problem, and treating post-purchase experience as part of subscription growth, not just support.
Why Your Subscription Numbers Might Be Lying to You
A common scenario looks like this. A merchant opens Shopify Analytics on Monday morning, sees a strong revenue graph, and assumes the subscription program is fine. Then support reports a wave of order edit requests, operations flags shipment issues, and the retention team notices more skips and cancellations than expected.
The store isn't short on activity. It's short on signal. Total sales tell you what happened. They don't tell you whether recurring revenue is expanding, whether subscribers are sticking, or whether post-purchase friction is pushing customers out.
That's why a subscription program needs its own measurement layer. If you lump subscriptions together with one-time orders, your reporting starts to reward noise. A flash sale can make the month look healthy while recurring revenue stalls. A broad AOV increase can distract from the fact that repeat subscribers are spending less over time or canceling faster than before.
What vanity metrics hide in Shopify
In e-commerce, misleading numbers usually come from blending unlike events:
- Total revenue masks mix shifts: If one-time purchases rise while subscription revenue softens, the top line can still look great.
- Order count ignores quality: More orders don't help if subscribers churn after the first billing cycle.
- AOV can flatter weak retention: Bigger baskets from campaigns can cover a shrinking base of recurring customers.
- Support volume gets treated separately: But unresolved shipping edits, wrong addresses, and change requests often show up later as cancellations.
Practical rule: If your team can't isolate subscription revenue behavior from promotional noise, you're managing a recurring business with one-time retail reporting.
A useful framing comes from the North Star Metric guide. The point isn't to chase one magical KPI. It's to choose a metric system that reflects how customers get value. For a subscription brand, that usually means retention and recurring revenue quality matter more than raw order volume.
You also need reporting that's native to Shopify reality, not just generic SaaS thinking. A strong primer on tracking and understanding Shopify analytics for smarter decisions is helpful because it forces you to separate broad store performance from subscription-specific health.
What honest subscription reporting looks like
Good subscription reporting answers a tighter set of questions:
| Question | Useful metric view |
|---|---|
| Are subscriptions growing predictably? | MRR and ARR |
| Are customers leaving faster than we can replace them? | Customer churn and revenue churn |
| Are existing subscribers worth more over time? | ARPA, LTV, NRR |
| Is post-purchase friction hurting retention? | Churn cohorts, support reasons, order-edit demand |
If your numbers feel inconsistent, they probably are. Not because the data is wrong, but because the business is being measured through the wrong lens.
MRR, ARR, ARPA, and CAC Explained
A Shopify Plus brand can have a strong top-line month and still weaken the subscription business underneath. A sale drives first orders, subscriber count ticks up, and total revenue looks healthy. Then renewals come in lower, discount-heavy cohorts drag down average account value, and paid acquisition gets more expensive. These four metrics help separate real subscription progress from retail noise.
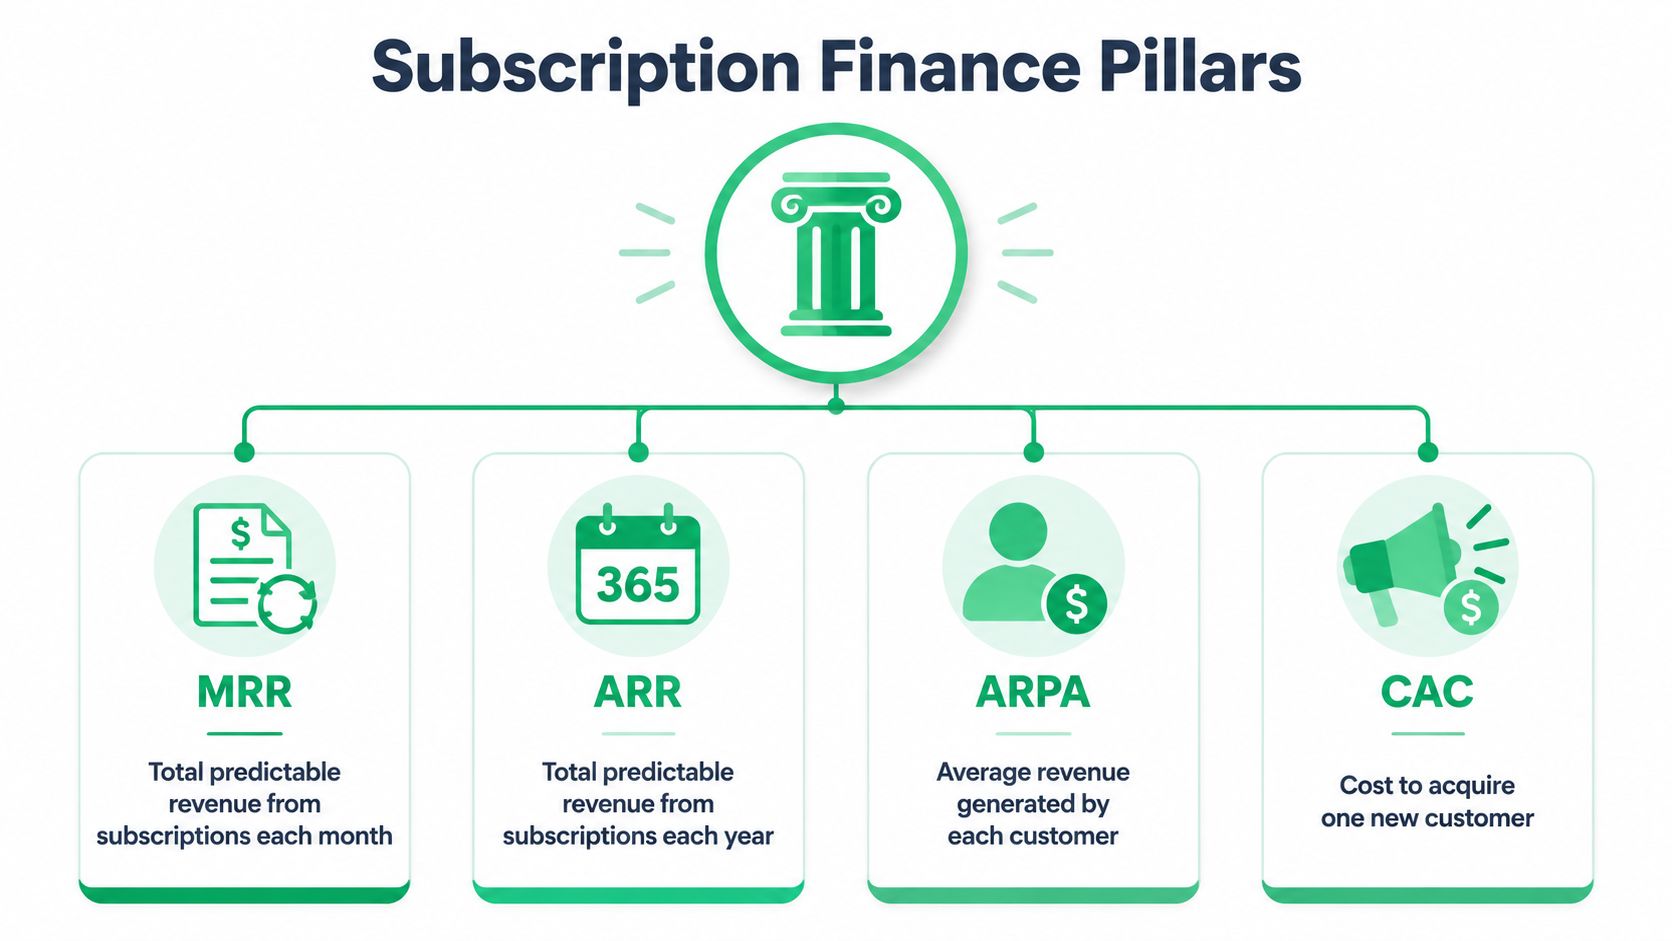
MRR shows what your subscriber base is producing now
Monthly Recurring Revenue (MRR) is the recurring revenue generated by active subscriptions in a month.
For a Shopify merchant, the practical version is simple. Add up the expected recurring revenue from all active subscriber relationships for the month, excluding one-time orders. If 2,000 subscribers are each paying $30 on their current cadence, MRR is about $60,000 before failed payments, skips, downgrades, and churn change the picture.
That last part matters. Shopify brands rarely run a perfectly flat subscription book. Billing cadence, prepaid plans, failed renewals, product swaps, and cancellation timing all affect reported MRR. If you want the number to be useful, calculate it the same way every month and keep one-time upsell revenue separate.
ARR gives leadership a planning number
Annual Recurring Revenue (ARR) is your recurring revenue run rate over a year.
Formula:
- ARR = MRR × 12
Finance cares about ARR because it helps with inventory planning, hiring, and cash flow forecasting. Operators should care too, but with caution. ARR is only as credible as the MRR underneath it. If your subscription program is heavily promo-driven or your retention is weak, ARR can look more stable than the business really is.
ARPA tells you whether subscriber quality is improving
Average Revenue Per Account (ARPA) measures recurring revenue per active subscriber account.
Formula:
- ARPA = recurring revenue ÷ active subscriber accounts
ARPA is one of the fastest ways to see whether your subscription offer is getting stronger or just getting bigger. A brand with 5,000 subscribers at $18 ARPA is in a different position than a brand with 3,500 subscribers at $29 ARPA, especially if the second group retains better and needs less support.
On Shopify, ARPA usually moves for operational reasons, not abstract financial ones. Bundle strategy changes it. Product mix changes it. Post-purchase merchandising changes it. If you enable recurring payments on Shopify and then add post-purchase upsells for subscribers into better bundles or complementary products, ARPA can rise without increasing acquisition spend.
That is one reason I like ARPA as an operating metric. It shows whether merchandising, offer design, and account experience are improving account value right now.
CAC shows what growth costs you
Customer Acquisition Cost (CAC) is the cost to acquire one new customer.
Formula:
- CAC = total sales and marketing spend ÷ number of new customers acquired
For subscription analysis, the better question is narrower. What does it cost to acquire a new subscriber, by channel, after discounts and conversion incentives? Many Shopify brands understate CAC because they blend one-time purchasers and subscribers into the same number. That hides whether the subscription offer can support paid growth.
Channel-level CAC is where the trade-offs become clear. Meta may drive cheaper first purchases, but if those customers convert to subscription at a lower rate or churn quickly, subscriber CAC is worse than it looks. Creator partnerships or email capture flows may cost more upfront and still produce a healthier payback period because the subscribers they bring in stay longer.
If CAC is rising, the fix is not always cheaper media. Sometimes the better move is to improve conversion to subscription after the first purchase, raise ARPA with a relevant upsell, or reduce customer churn so each acquired subscriber produces more revenue over time.
How to read these four together
Used together, these metrics give a more honest read on subscription health:
- MRR shows current recurring revenue size.
- ARR turns that into a planning view.
- ARPA shows whether each account is becoming more valuable or less.
- CAC shows what it costs to add the next subscriber.
The useful pattern is correlation, not isolated reporting. If MRR is rising while ARPA falls, growth may be coming from lower-value plans or heavier discounting. If ARPA rises but CAC climbs faster, margin can still tighten. If MRR holds steady because acquisition is masking churn, the business is less stable than the dashboard suggests.
A good operating cadence is straightforward. Review MRR weekly, review ARPA monthly, and review subscriber CAC by channel every time you assess paid spend. That is usually enough to catch a weak offer, an overpriced acquisition source, or an underused post-purchase opportunity before the gap shows up in retention.
Measuring and Reducing Customer Churn Rate
A Shopify subscription program can post strong first-order conversion, rising MRR, and efficient CAC, then still underperform because too many subscribers cancel after month one or two. Churn is the metric that exposes whether the model holds up after checkout.

For Shopify brands, churn is rarely just a pricing problem. It often shows up when the subscription experience creates avoidable friction. Customers cannot edit the next order. They miss the skip window. Billing surprises them. Support has to handle simple changes that should have been self-serve. Those issues push cancellation rates up even when the product itself is strong.
Track churn two ways.
Customer churn measures the percentage of subscribers who cancel in a given period.
Revenue churn measures the percentage of recurring revenue lost from cancellations and downgrades in that same period.
Revenue churn usually deserves more attention from a Shopify Plus operator. If ten low-value subscribers cancel, that hurts. If three high-AOV subscribers on larger bundles cancel, the financial impact can be worse even though customer churn looks lower. Brands that only watch subscriber count miss that difference.
The practical formula is simple. Start with active subscribers and subscription revenue at the beginning of the month. Then calculate how many subscribers left, and how much recurring revenue disappeared because of cancellations, failed renewals that were never recovered, or plan downgrades. Keep one-time purchases out of this view. Otherwise the number gets noisy and you lose the operating signal.
Cohort analysis makes churn useful.
Group subscribers by the month they started, then review how long each cohort stays active. That shows where the leak begins and what kind of fix is needed.
- Early churn usually points to a weak offer-to-audience match, poor onboarding, or a discount-driven first order that never converted into habit.
- Mid-cycle churn often comes from experience issues such as inflexible skips, hard-to-find account controls, shipping cadence problems, or repetitive product fatigue.
- Late churn tends to mean customers got value, then stopped seeing enough reason to stay on the current plan or bundle.
In Shopify, early and mid-cycle churn are often more fixable than teams assume. If subscribers can swap products, skip an order, change frequency, or update shipping details without opening a support ticket, retention usually improves because fewer customers cancel over operational annoyances. A guide to recurring payments for Shopify subscriptions is useful here because billing logic and customer experience are tightly connected.
Post-purchase optimization affects churn more directly than many brands realize. A relevant post-purchase upsell can raise order value, but it can also improve retention if it moves the subscriber into a better-fit bundle from the start. The same is true for account management tools. If SelfServe reduces the effort required to edit an order or recover a failed payment, churn drops for reasons that have nothing to do with ad spend and everything to do with subscriber control.
The best churn reduction work is operational, not abstract:
- Separate voluntary and involuntary churn. A customer who chose to cancel needs a different fix than a customer whose payment failed.
- Tag cancellation reasons with real detail. “Too expensive” should not sit in the same bucket as “couldn't change next order.”
- Review churn by acquisition source. Paid social subscribers from a heavy first-order incentive often behave differently from subscribers who joined after a replenishment reminder or product education flow.
- Audit month-one support tickets. If new subscribers repeatedly ask how to skip, swap, or delay, the account experience is creating retention risk.
- Use save flows selectively. Offer a skip, frequency change, or smaller bundle before a full cancellation. Do not train every subscriber to expect a discount.
If you need a broader framework to reduce customer churn, start with behavior patterns and cancellation reasons, then connect them back to the actual moments where subscribers get stuck.
A short explainer is useful here before you audit your own data:
One point matters more than any benchmark. Small improvements in churn preserve recurring revenue every month, and that gain stacks over time. That is why churn should be owned across support, lifecycle, merchandising, and subscription operations, not left to finance after the fact.
Beyond the Basics with LTV, NRR, and Activation Rate
A Shopify subscription program can show healthy top-line growth while getting weaker underneath. New customers keep coming in, MRR rises, and paid acquisition looks productive. Then margins tighten because first-order subscribers never become second-order subscribers, account edits are frustrating, and expansion revenue never shows up.
That is why LTV, NRR, and activation rate matter.

These three metrics answer a harder question than “are subscriptions growing?” They show whether your subscriber base becomes more valuable after checkout, or whether you are replacing weak retention with more acquisition spend.
LTV shows whether subscriber economics actually work
Customer Lifetime Value (LTV) measures the revenue a subscriber generates across the full relationship. For a Shopify brand, that number moves on very operational inputs: how long the subscriber stays active, how often they reorder, whether they add one-time products, and whether they move into higher-value bundles.
LTV gets misread all the time. Teams often calculate it from blended customer data, then assume the subscription offer is healthy. In practice, subscription LTV should be broken out by plan, acquisition source, and first-order offer. A prepaid subscribe-and-save customer acquired through branded search usually behaves differently from a subscriber who came in through a steep discount on paid social.
For a practical refresher on the mechanics, this guide on understanding customer lifetime value is worth reading.
The operating question is simple. Does the revenue you get after the first order justify what you paid to acquire that subscriber? If the answer depends on discounting, forced continuity, or constant win-back campaigns, LTV is weaker than the spreadsheet suggests.
NRR shows whether your current subscriber base is expanding or shrinking
Net Revenue Retention (NRR) tracks what happens to recurring revenue from an existing subscriber cohort after upgrades, add-ons, skips, downgrades, and cancellations. It is one of the clearest ways to see whether post-purchase experience is improving account value or capping it.
For Shopify subscription brands, NRR usually comes down to three revenue movements:
| NRR driver in Shopify subscriptions | What to look for |
|---|---|
| Expansion | Add-on products, bundle upgrades, higher-value product swaps, post-purchase upsells |
| Contraction | Subscribers dropping items, switching to lower-priced variants, extending delivery cadence |
| Churn | Full cancellations and failed rebills that are never recovered |
This metric gets more useful when you stop treating expansion as accidental. A brand that enables post-purchase upsells, one-click add-ons in the customer portal, and smart reorder recommendations often improves NRR without touching acquisition. A brand that makes subscribers contact support to change flavors or add products usually leaves expansion revenue on the table.
That is the Shopify-specific angle many SaaS-style subscription guides miss. Your retention number is tied to merchandising decisions, portal UX, and fulfillment flexibility, not just pricing.
Activation rate gives you an earlier read on retention quality
Activation rate measures how many new subscribers reach the first point where the subscription starts working as intended. On Shopify, that milestone is rarely just “completed checkout.” A better activation event is something operational and observable.
Examples include:
- First recurring order processed successfully
- Subscriber logs into the portal and sets cadence or product preferences
- Customer uses skip, swap, or edit controls without contacting support
- Subscriber accepts a post-purchase add-on or builds a larger routine after order one
The right activation definition depends on the product. For supplements, activation may mean the second order goes through on schedule. For coffee or pet food, it may mean the customer adjusts frequency before inventory piles up. For skincare, it may mean the subscriber adds the companion product that makes the regimen stick.
Activation is an early warning system. If many new subscribers never reach that point, later churn should not surprise anyone.
Track how post-purchase actions change these metrics
A useful Shopify subscription analysis should connect metric movement to actions inside the customer journey. Otherwise, LTV, NRR, and activation stay abstract.
Here is a practical example. If you add a post-purchase upsell after the initial subscription checkout, you may increase first-cycle revenue immediately. If that upsell is relevant, easy to accept, and visible before the customer leaves the thank-you flow, it can also raise LTV by increasing average order value across the relationship. If the same setup lets subscribers manage upcoming orders without support friction, NRR can improve too because more customers expand instead of downgrade or cancel.
The reverse is just as common. A brand spends aggressively to acquire subscribers, then sends them into a portal with weak edit controls, no reorder flexibility, and no clear path to add products. Activation stays low, expansion stays weak, and the business mistakes top-line acquisition for retention strength.
A closer look at how to increase customer lifetime value is useful if your team still treats upsells, retention, and subscription operations as separate workstreams. On Shopify, they are tightly connected.
Building Your Subscription Metrics Dashboard
A useful dashboard for subscription business model metrics should feel like a cockpit, not a scrapbook. Most Shopify teams already have the data somewhere. The issue is that the dials aren't arranged to support decisions.
Use three dashboard layers
The cleanest setup has three levels.
Headline metrics
These are the numbers leadership checks first:
- MRR: The current size of recurring revenue.
- ARR: The annualized view of that recurring base.
- Customer churn: A fast signal that retention may be slipping.
- Revenue churn: The economic cost of churn, not just the subscriber count.
- ARPA: Whether average account value is improving or weakening.
These should sit at the top with trend lines, not isolated snapshots. A single month rarely tells the truth in subscriptions.
Diagnostic metrics
These explain why the headline numbers moved:
- Churn by cohort: Start month, plan type, first-to-second order survival.
- Downgrade reasons: Pricing, product fit, delivery issues, change friction.
- Support-linked cancellation reasons: Cases where service problems preceded churn.
- Discount exposure: Whether heavy first-order offers are attracting low-retention subscribers.
Most dashboard builds fail at this stage. Teams put every KPI on one screen and call it visibility. What they need is cause-and-effect visibility.
The best dashboard doesn't show more metrics. It makes the relationship between metrics obvious.
Predictive metrics
These tell you whether growth is getting stronger or more fragile:
- LTV
- LTV to CAC
- NRR
- Activation rate
- Post-purchase expansion contribution, if your team tracks that separately
Keep the benchmark table simple
Here's a practical version for DTC teams that need context without overcomplicating it.
DTC Subscription Benchmarks (2026)
| Metric | Poor | Good | Excellent (DTC) |
|---|---|---|---|
| Monthly churn | Above 12% | 8-12% | Below 8% |
| MRR growth MoM | Below 5% | 5-15% | Above 15% |
| ARR growth YoY | Below 15% | 15-30% | Above 30% |
| ARPU growth YoY | Stalled below 15% | Improving with less friction | Strong expansion supported by post-purchase upsells |
The churn and ARPU rows reflect the DTC framing discussed earlier from Apps365, which presents those numbers as part of a 2025 Shopify report. The MRR and ARR rows follow the benchmark ranges already cited from the Crystallize source.
What to avoid in dashboard design
Three mistakes show up repeatedly in Shopify environments:
- Mixing one-time and subscription revenue on the same primary chart
- Reporting only totals, not cohort retention
- Reviewing static monthly snapshots without trend lines or reason codes
If your dashboard can't help the support lead, the retention manager, and the finance team answer the same question from different angles, it needs to be rebuilt.
How to Improve Your Subscription Metrics Today
Most subscription gains come from removing friction before trying to manufacture growth. That's especially true on Shopify, where customer experience after checkout affects whether revenue repeats.
Start with the metric that hurts most
If churn is your biggest issue, don't begin with bigger acquisition budgets. Fix the reasons people leave.
- To reduce churn: Remove preventable post-purchase issues. Give customers a clean way to update shipping details, fix mistakes, and manage simple changes without opening support tickets.
- To improve activation rate: Audit the first subscriber experience. Make sure the first order, first communication, and first account interaction are simple and predictable.
- To increase ARPA: Add relevant expansion opportunities after purchase, not just before checkout.
- To raise NRR: Focus on existing subscribers first. Expansion from the current base is usually less fragile than growth from constantly replacing churned customers.
- To strengthen LTV: Treat retention, operations, and merchandising as one system. A customer who stays longer and adds value over time is far more profitable than one acquired cheaply and lost quickly.
Match actions to the underlying cause
Here's the trade-off that matters. Some brands try to solve weak retention with stronger discounting. That can lift signups and make top-line growth look better for a while. It often lowers subscriber quality and creates more churn later.
A better sequence looks like this:
| Problem | Weak response | Better response |
|---|---|---|
| High early churn | More aggressive first-order discount | Tighten offer targeting and improve onboarding |
| Low ARPA | Constant sitewide discounting | Add relevant upsells and bundle logic |
| Weak NRR | Spend harder on acquisition | Grow value from the existing subscriber base |
| Rising support-related cancellations | Hire more agents | Remove the underlying customer friction |
Think operationally, not just analytically
The brands that improve subscription metrics fastest usually do three things well:
- They classify issues cleanly: They know whether churn came from price, product, delivery, or support friction.
- They connect teams around one metric system: Lifecycle, support, operations, and finance aren't all using different definitions.
- They turn post-purchase into a growth surface: They don't treat the thank-you page and order status experience as dead space.
Good subscription performance usually looks boring from the outside. Fewer avoidable errors. Cleaner edits. Better expansion timing. Clearer reporting. That's what compounds.
If you're running a Shopify subscription program, the most effective move is usually not another dashboard widget. It's fixing the customer moments that feed the metrics you care about.
If your team wants to cut support-heavy friction and create better post-purchase revenue opportunities, SelfServe is built for that layer of the Shopify experience. It helps shoppers manage order changes within rules you control, supports multilingual experiences, validates addresses in real time, and adds upsell opportunities on Thank You and Order Status pages. For Shopify Plus brands, that means fewer preventable tickets, cleaner operations, and stronger subscription economics from the same customer base.